


BTCUSD and XRPUSD Technical Analysis – 20th DEC 2022
FXOpen

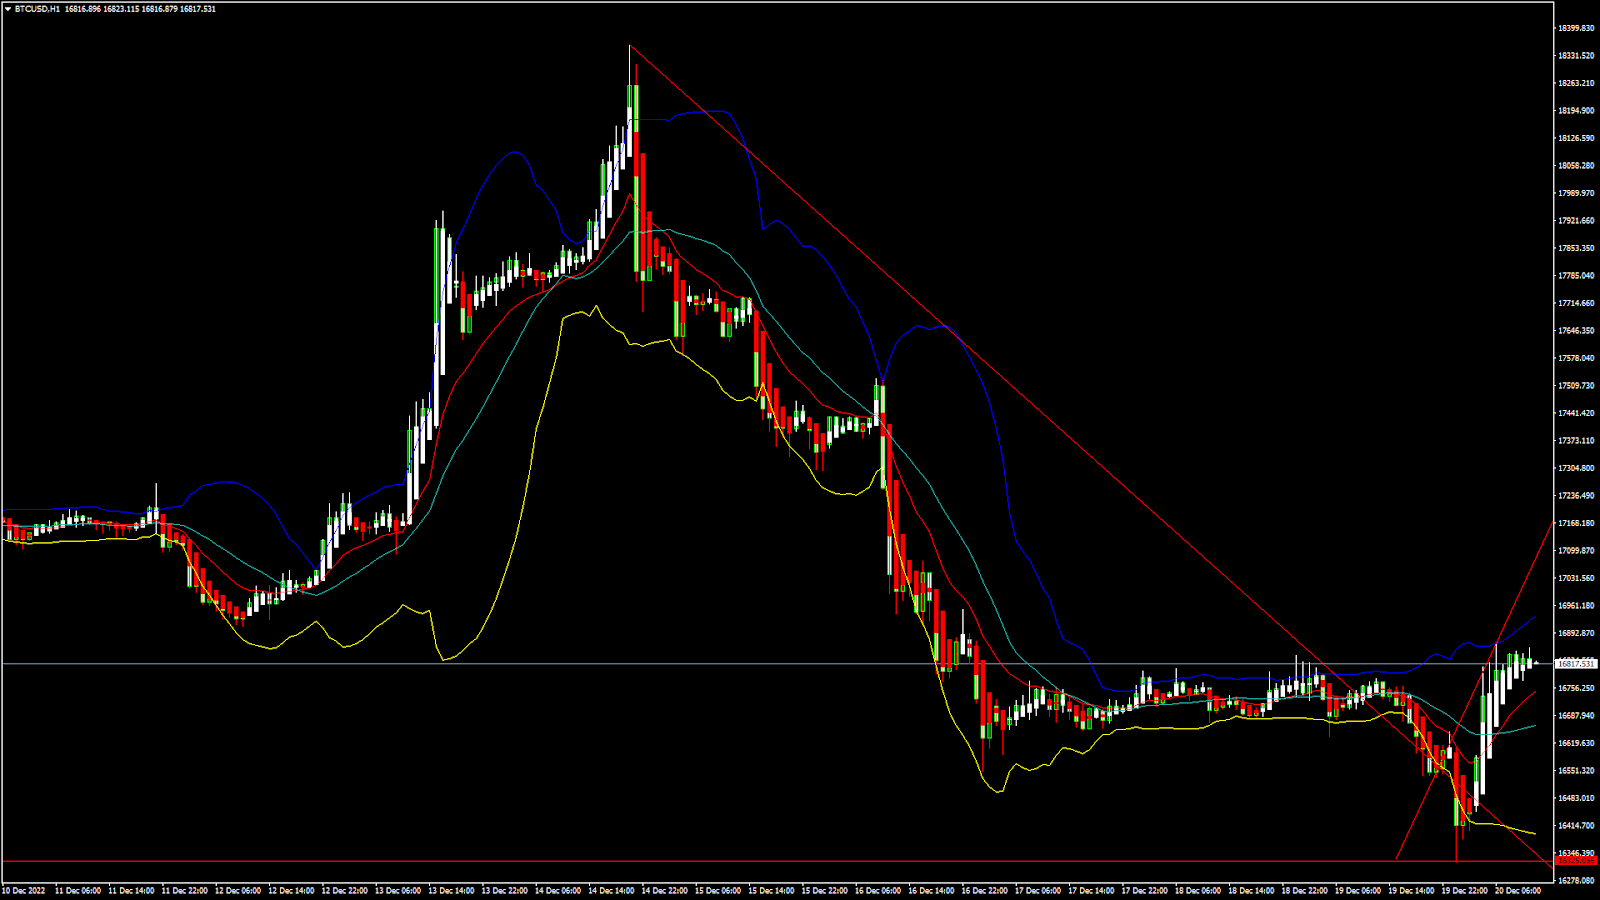
BTCUSD: Bullish Harami Pattern Above $16325
Bitcoin was unable to sustain its bullish momentum and after touching a high of $18360 on 14th Dec, the price started to decline against the US dollar coming down below the $16500 handle in the early Asian trading session today.
The price of bitcoin has since bounced back from its lows touching $16800 levels in the European Trading session today.
We have seen a bullish opening of the markets this week.
We can clearly see a bullish harami pattern above the $16325 handle which is a bullish reversal pattern because it signifies the end of a downtrend and a shift towards an uptrend.
Bitcoin touched an intraday low of 16322 in the Asian trading session and an intraday high of 16846 in the European trading session today.
We can see the formation of the bullish trend reversal pattern with the adaptive moving average AMA20 and MA20 in the 4-hour time frame.
Both the RSI and STOCHRSI are indicating overbought levels which means that in the immediate short term, a decline in the prices is expected.
The relative strength index is at 75 indicating an OVERBOUGHT level for bitcoin, and the possibility of an immediate correction in the price towards the $16500 levels.
Bitcoin is now moving above its 100 hourly simple moving average and below its 200 hourly exponential moving average.
All of the major technical Indicators are giving a STRONG BUY signal, which means that in the immediate short term, we are expecting targets of 17000 and 18500.
The average true range is indicating high market volatility with a strong bullish momentum.
- Bitcoin: bullish reversal seen above $16325
- The Williams percent range is indicating an overbought level
- The price is now trading just below its pivot level of $16822
- The short-term range is mildly bullish
Bitcoin: Bullish Reversal Seen Above $16325
We can now see that the price of bitcoin is moving in a mildly bullish momentum, and we are expecting moves towards the $17000 levels before any market consolidation this week.
Some of the technical indicators are also giving a neutral tone of the markets.
We are now waiting for the next upwards leg above the $17500 handle which will push the prices towards the $18000 level.
The price of bitcoin is expected to enter into a super bullish zone after crossing the $18000 level.
The immediate short-term outlook for bitcoin is strongly bullish, the medium-term outlook has turned bullish, and the long-term outlook remains neutral under present market conditions.
Bitcoin’s support zone is located at $16329 which is a 3-10 day MACD oscillator stalls.
The price of BTCUSD is now facing its classic resistance level of 16862 and Fibonacci resistance level of 16885 after which the path towards 17500 will get cleared.
In the last 24hrs, BTCUSD has increased by 0.28% by 47.59$ and has a 24hr trading volume of USD 21.646 billion. We can see an increase of 72.88% in the trading volume compared to yesterday, which is due to heavy buying action seen at lower levels.
The Week Ahead
Bitcoin’s price is gaining pace above the $16000 handle and might soon break the $17000 level for more gains above $18000.
The price of Bitcoin has failed to clear the resistance at $18360 and we are now again testing the $18000 level soon.
The start of the festive season with Christmas and New Year holidays might dampen the interest of the global investors, and we will have to wait for the New Year 2023.
The daily RSI is printing at 46 which indicates a NEUTRAL demand for bitcoin and the possibility of a shift towards the consolidation/correction phase for a short term in the markets.
The price of BTCUSD is now facing its resistance zone at $17789 which is a 38.2% retracement from a 13 week low.
The weekly outlook is projected at $18000 with a consolidation zone of $17500.
Technical Indicators:
The average directional index, ADX (14): is at 36.24 indicating a BUY
The ultimate oscillator: is at 58.98 indicating a BUY
The rate of price change, ROC: is at 1.246 indicating a BUY
Bull/bear power (13): is at 144.44 indicating a BUY
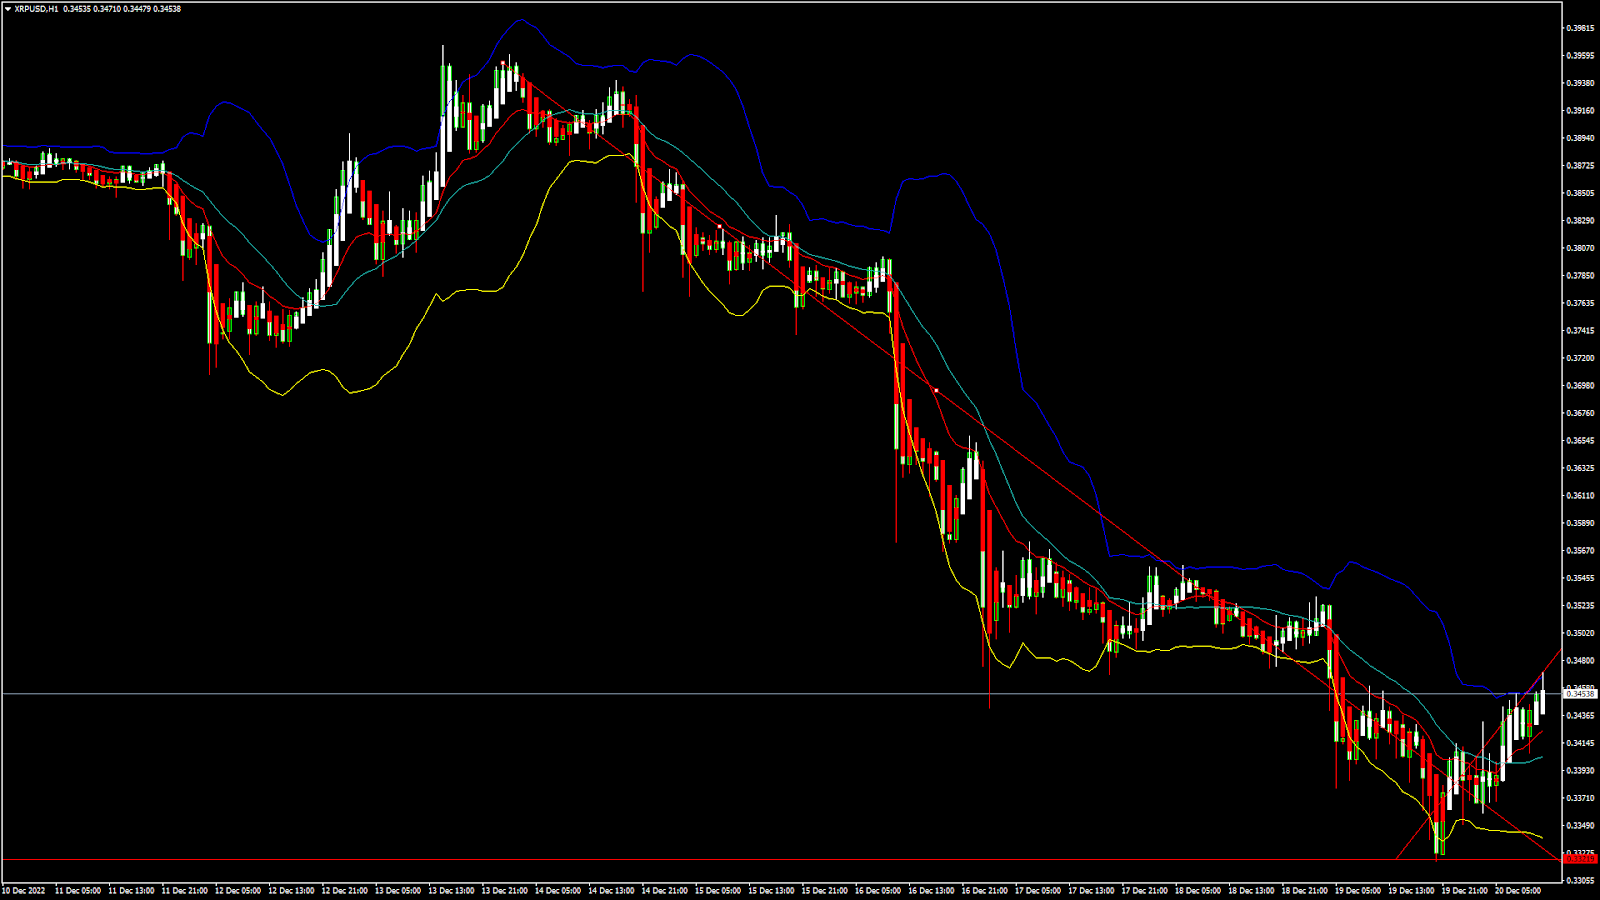
XRPUSD: Double Bottom Pattern Above 0.3321
Ripple was unable to sustain its bullish momentum and after touching a high of 0.3966 on 13th Dec, the price started to decline against the US dollar coming down below the 0.3500 handle.
After this decline the price has started to bounce back and is moving in a mildly bullish zone and we are now heading towards the $0.3500 to $0.3700 range.
The Williams percent range is back over -50 in the 4-hour time frame indicating a bullish tone of the markets.
We can clearly see a double bottom pattern above the 0.3321 handle which is a bullish reversal pattern because it signifies the end of a downtrend and a shift towards an uptrend.
Ripple touched an intraday low of 0.3353 in the Asian trading session and an intraday high of 0.3468 in the European trading session today.
The relative strength index is at 57.75 which signifies a STRONG demand for Ripple at the current market prices and the continuation of buying pressure in the markets.
Most of the moving averages are giving a STRONG BUY signal at the current market level of 0.3454.
Ripple is now trading above its pivot level of 0.3447 and facing its classic resistance level of 0.3458 and Fibonacci resistance level of 0.3464 after which the path towards 0.3600 will get cleared.
All of the major technical indicators are giving a STRONG BUY signal.
- Ripple: bullish reversal seen above the 0.3321 level
- The Williams percent range is indicating an OVERBOUGHT level
- The average true range indicates LESS volatility
- Ripple gains bullish bias against the US dollar
Ripple: Bullish Reversal Seen Above 0.3321
We can see that the price of Ripple continues to remain in a bullish zone formation above the $0.3400 handle and fresh upsides are projected at $0.3700 and $0.4000.
The price of Ripple is back over the pivot point in the daily time frame.
We can see the formation of a bullish price crossover pattern with the adaptive moving average AMA20 in the 4-hour time frame.
The RSI indicator is back over 50 in the 2-hour time frame.
The resistance of the channel is broken in the 1-hour time frame.
The momentum indicator is back over zero in the 15-minute time frame indicating a bullish tone in the markets.
The short-term outlook for Ripple has turned mildly bullish, the medium-term outlook is bullish, and the long-term outlook is neutral under present market conditions.
The price of XRPUSD has increased by 0.06% with a price change of $0.0002105 in the past 24hrs and has a trading volume of 1.055 billion USD.
We can see an increase of 64.81% in the trading volume of Ripple compared to yesterday, which is due to the buying seen at lower levels.
This Week Ahead
The price of Ripple is moving in a mildly bullish momentum against the US dollar and bitcoin. There is a major bullish trendline formation with a support located at $0.3188 which is 3-10 day MACD oscillator stalls.
The price of Ripple has made a third failed attempt to cross the $0.4200 handle in the last 30 days and now remains below the $0.3500 level.
We can see a continuous progression of a bullish trend line formation from $0.3321 towards the $0.3485 level.
The resistance zone is located at $0.3821 at which the price crosses 9-day moving average stalls and at $0.3954 which is a 14-3 day raw stochastic at 80%.
The weekly outlook for Ripple is projected at $0.3700 with a consolidation zone of $0.3600.
Technical Indicators:
The MACD (12,26): is at 0.000 indicating a BUY
The commodity channel index, CCI (14): is at 122.09 indicating a BUY
The rate of price change: is at 1.73 indicating a BUYBull/Bear power (13): is at 0.0044 indicating a BUY
FXOpen offers the world's most popular cryptocurrency CFDs*, including Bitcoin and Ethereum. Floating spreads, 1:2 leverage — at your service (additional fees may apply). Open your trading account now or learn more about crypto CFD trading with FXOpen.
*Important: At FXOpen UK, Cryptocurrency trading via CFDs is only available to our Professional clients. They are not available for trading by Retail clients. To find out more information about how this may affect you, please get in touch with our team.
This article represents the opinion of the Companies operating under the FXOpen brand only. It is not to be construed as an offer, solicitation, or recommendation with respect to products and services provided by the Companies operating under the FXOpen brand, nor is it to be considered financial advice.
Stay ahead of the market!
Subscribe now to our mailing list and receive the latest market news and insights delivered directly to your inbox.


Latest articles

Dow Jones (DJIA): Consolidation Beyond the Trend
Federal Reserve Chair Kevin Warsh testified before Congress on 14–15 July, reaffirming the Fed's commitment to bringing inflation back to target while providing no clear guidance on the future path of interest rates. Meanwhile, June inflation data came in

European Currencies Strengthen Ahead of Key Macroeconomic Releases
EUR/USD and GBP/USD continue to recover moderately following the recent weakening of the US dollar. European currencies have been supported by expectations that US inflationary pressures will continue to ease after softer-than-expected CPI and PPI data, reinforcing market

Brent Crude Oil: From Ceasefire to Crossfire — What's Next?
Just weeks ago, traders were pricing in peace. Now they're pricing in war again—and that reversal says everything about how fragile the current Middle East calm really is.
Brent crude has surged to $86 a barrel, its highest level