


BTCUSD and XRPUSD Technical Analysis – 25th JAN 2022
FXOpen
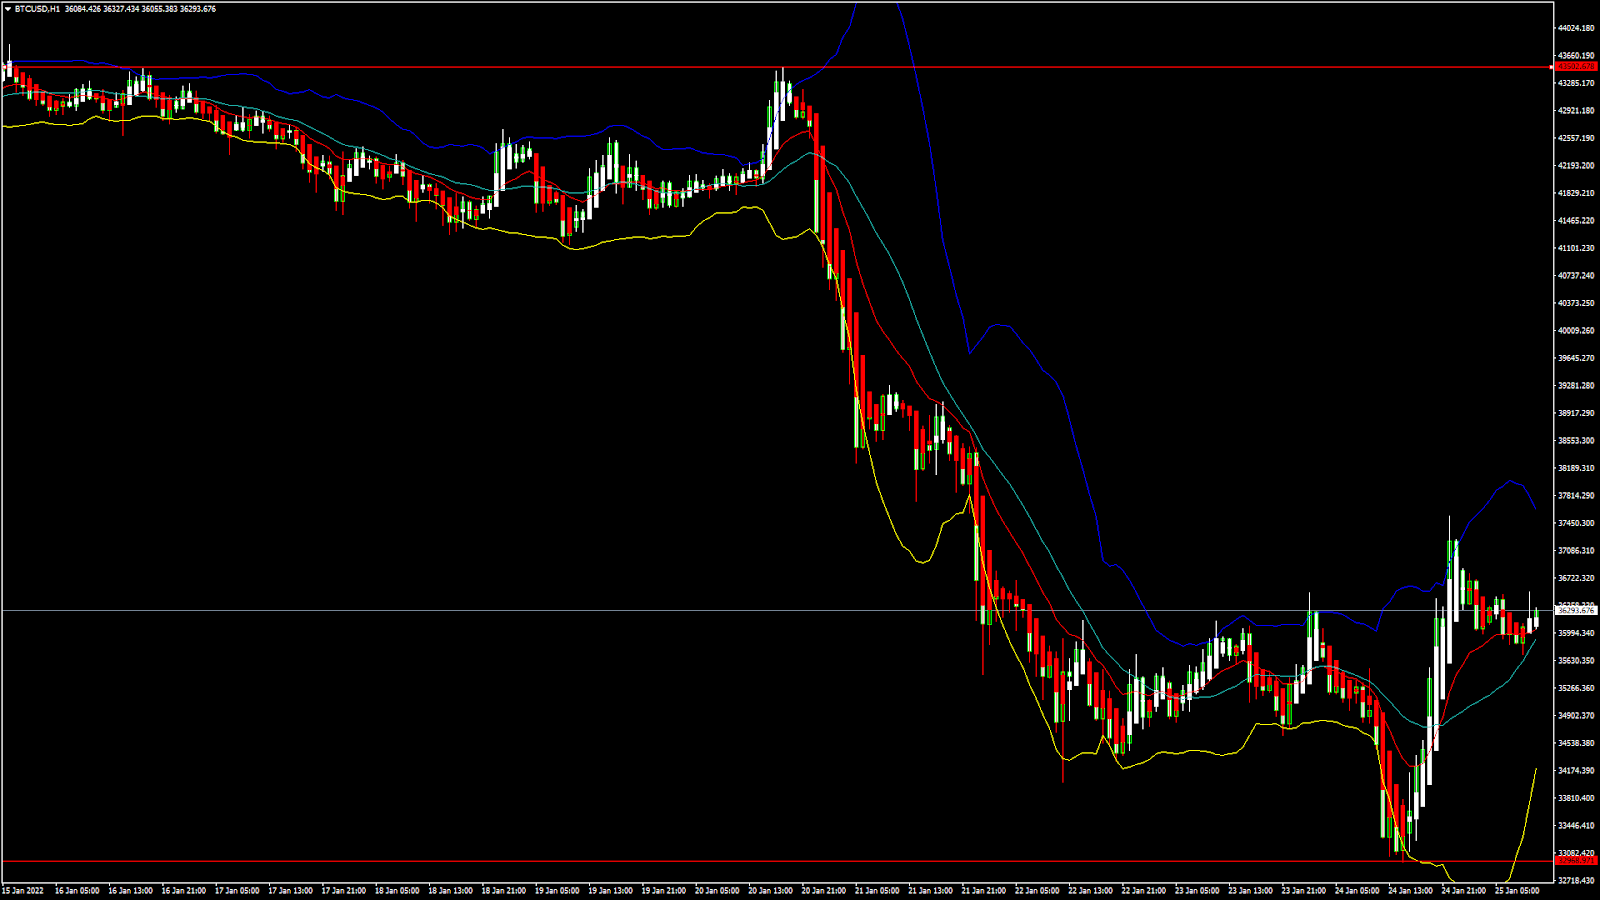
BTCUSD – Double Bottom Pattern Above $32000
Bitcoin had a major bearish correction after touching a high of 43296 on 20th January, the prices continued to decline touching a low of 33053 yesterday.
This sharp drop in the levels of Bitcoin was due to heavy selling in the markets coupled with the fears of a Russian attack on Ukraine.
Today BTCUSD has entered into a mild bullish momentum and continues to remain above the $36000 handle in the European Trading session.
We can clearly see a Double Bottom Pattern above the $32000 handle which is a Bullish reversal pattern because it signifies the end of a downtrend and a shift towards an Uptrend.
STOCH and Williams Percent Range are indicating OVERBOUGHT levels which means that in the immediate short term a decline in the prices is expected.
Relative Strength Index is at 55 indicating a STRONG demand for the Bitcoin at the current market levels.
Bitcoin is now moving Above its 100 hourly Simple Moving average and below its 200 hourly Exponential Moving averages.
Average True Range is indicating Less Market Volatility with a Bullish zone formation.
- Bitcoin Trend Reversal is seen Above $32000.
- STOCHRSI is Indicating OVERSOLD Levels.
- The price is now trading just Above its Pivot Levels of $36246.
- Most of the Moving Averages are giving a BUY market signal.
Bitcoin Bullish Reversal Above $32000 Confirmed
Bitcoin is forming a Bullish Reversal pattern as the prices continue to Uptick in the European Trading session today.
The immediate short-term outlook for Bitcoin is Bullish, Medium-term outlook is Neutral, and the long-term outlook remains Strong Bullish.
All of the Major Technical Indicators are giving a BUY Signal, which means that in the immediate short term we are expecting targets of 38000 and 40000.
The price of BTCUSD is now facing its Classic resistance levels of 36426 and Fibonacci resistance levels of 36735 after which the path towards 38000 will get cleared.
In the last 24hrs BTCUSD is UP by 4.67% by 1619$ and has a 24hr trading volume of USD 41.650 Billion. We can see an Increase of 61.22% in the Trading volume as compared to yesterday.
This increase in the Trading volume of BTC is due to the increased Buying pressure after the recent decline, which saw many new investors coming into the markets.
The Week Ahead
The prices of Bitcoin entered into the consolidation phase after touching the $33000 handle and is now moving into a Mild Bullish momentum towards the $37000 levels.
We can expect more Upsides in the range of $38000 to $40000 in this week. The most important factor that is facing the Global investors is the news of a Russian attack on the Ukraine and its effects on the Crypto markets.
Since the liquidity fear is the most in the Cryptocurrencies, we saw a major drop in the levels of Bitcoin, which now appears to have stabilized.
The Crypto Winter
The prices of Bitcoin have declined from its November 2021 highs of $69000 by more than 50% which has resulted in the mass erosion of the investors wealth globally.
At present the Total market capitalization of Bitcoin stands at 685 Billion USD.
Many of the analysts have coined this Major decline as the Crypto Winter, which appears to be a difficult and challenging time for the Crypto Investors.
Technical Indicators:
Relative Strength Index (14days): It is at 55.72 indicating a BUY.
Average Directional Change (14days): It is at 22.27 indicating a BUY.
Rate of Price Change: It is at 0.432 indicating a BUY.
Moving Averages Convergence Divergence (12,26): It is at 161.80 indicating a BUY.
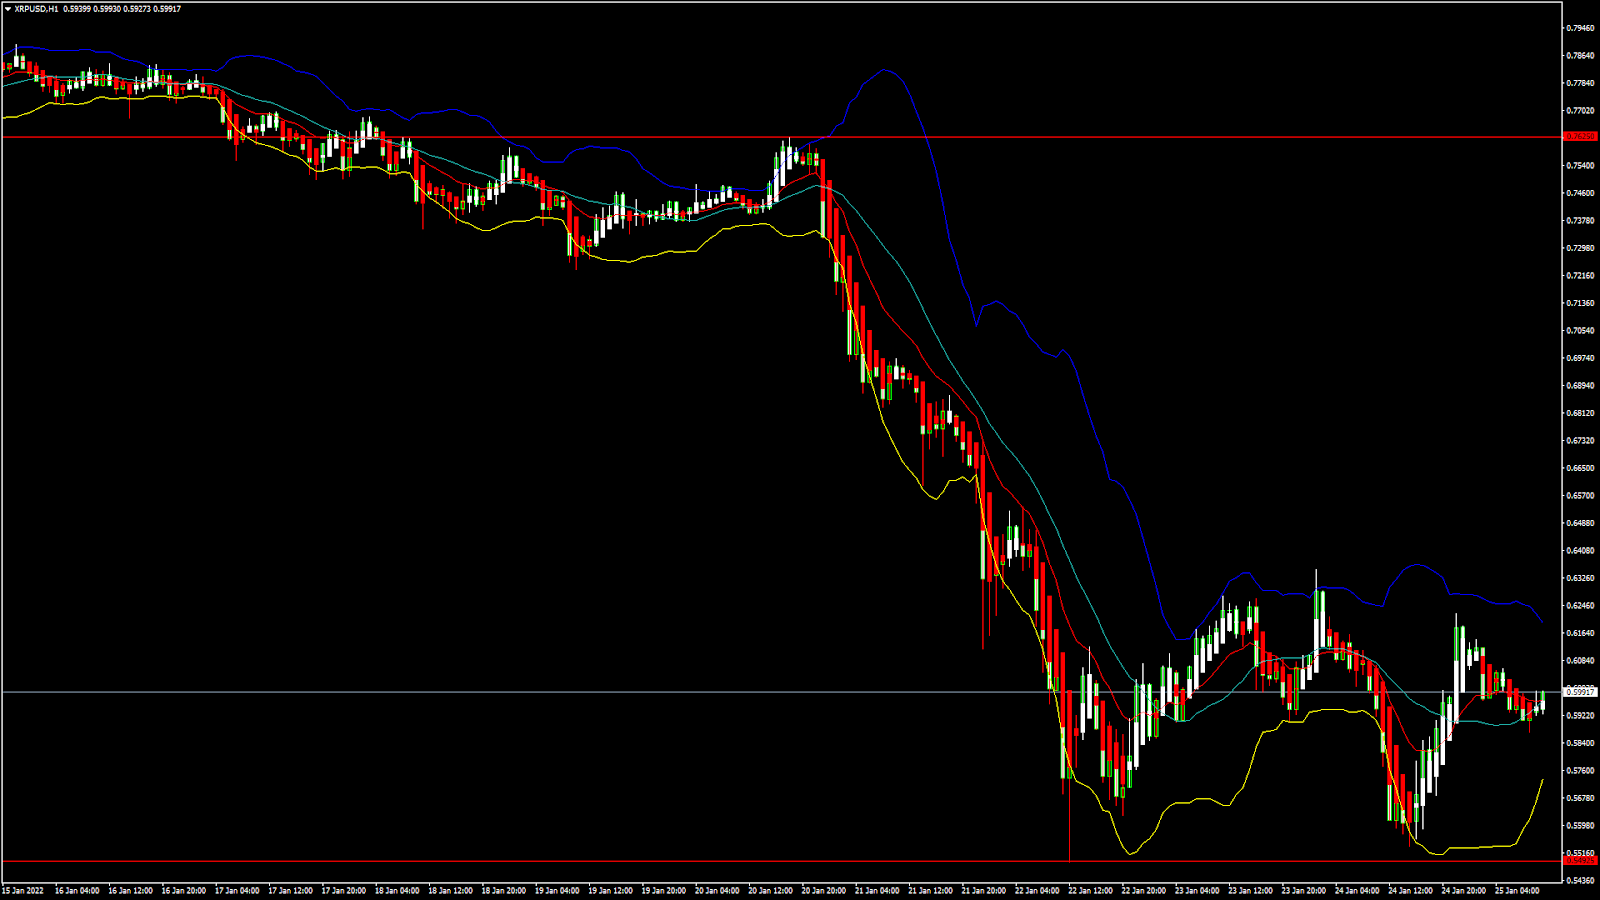
XRPUSD – Double Bottom Pattern Above 0.5400
Ripple was unable to sustain its bullish momentum this week and after touching a high of 0.7622 on 20th January the prices continued to decline touching a low of 0.5490 on 22nd January.
Today Ripple touched an Intraday High of 0.6144 in the Asian Trading session and an Intraday low of 0.5876 in the European Trading session.
We can clearly see a Double Bottom pattern above the 0.5400 levels which is a Bullish reversal pattern because it signifies the end of a downtrend and a shift towards an Uptrend.
The Short-term outlook for Ripple has turned Mild Bullish, Medium-term outlook remains Neutral, and the Long-Term outlook is Bullish.
Relative Strength Index is at 50 which signifies a Neutral market level and a move towards a consolidation phase.
Some of the Moving Averages are giving a BUY Signal at the current market levels of 0.5988
Ripple is now trading just above its Pivot levels of 0.5948 and is now facing its Classic resistance levels of 0.6043 and Fibonacci resistance levels of 0.6016 in the European Trading session.
- Most of the Technical Indicators are giving a NEUTRAL Signal.
- Ripple has entered into a Consolidation Channel above the 0.5400 levels.
- Average Directional Change is giving a NEUTRAL Signal.
- Average True Range indicates LESS Market Volatility.
Ripple Enters Consolidation Channel Above 0.5400
Ripple is now moving into a Consolidation phase above the 0.5800 handle in the European Trading session today.
We can also see a Mild Bullish momentum in place which is confirmed by the MA 20 and MA 10 crossover pattern at the levels of 0.5965
The prices of Ripple are expected to move in a narrow range between the 0.5800 and 0.6200 in the US Trading session today.
After the consolidation phase gets over, we can see a Bullish momentum towards the 0.7000 handle in the coming days.
The price of XRPUSD is UP by 2.99% with a price change of $0.01651 in the past 24hrs and has a trading volume of 2.657 Billion USD.
We can see a 53.64% Increase in the Trading volumes of Ripple in the Last 24 hours due to the renewed buying pressure after the recent decline.
This Week Ahead
The prices of XRPUSD are now moving into a Consolidation phase which is expected to continue today. We are now looking at a Mild Bullish trend formation which is confirmed with the MA crossover pattern.
In this week the prices of Ripple are expected to touch the 0.7000 handle and remain above these levels in the next week.
The upside correction in Ripple is long overdue which can be in the form of a Rally into the markets and pushing its prices above the 0.8500 handle.
The weekly outlook for Ripple is projected at 0.7000 with a consolidation zone of 0.7500
Technical Indicators:
Bull/Bear Power (13 days): It is at 0.0015 indicating a BUY.
Highs/Lows(14days): It is at 0.00 indicating NEUTRAL levels.
Average Directional Change (14days): It is at 15.82 indicating NEUTRAL levels.
Rate of Price Change: It is at 0.115 indicating a BUY.
FXOpen offers the world's most popular cryptocurrency CFDs*, including Bitcoin and Ethereum. Floating spreads, 1:2 leverage — at your service (additional fees may apply). Open your trading account now or learn more about crypto CFD trading with FXOpen.
*Important: At FXOpen UK, Cryptocurrency trading via CFDs is only available to our Professional clients. They are not available for trading by Retail clients. To find out more information about how this may affect you, please get in touch with our team.
This article represents the opinion of the Companies operating under the FXOpen brand only. It is not to be construed as an offer, solicitation, or recommendation with respect to products and services provided by the Companies operating under the FXOpen brand, nor is it to be considered financial advice.
Stay ahead of the market!
Subscribe now to our mailing list and receive the latest market news and insights delivered directly to your inbox.


Latest articles

Market Analysis: EUR/USD Revisits Support While USD/JPY Eyes Bigger Recovery Move
EUR/USD declined from 1.1800 and traded below 1.1750. USD/JPY is rising and might gain pace above 158.00 and 158.80.
Important Takeaways for EUR/USD and USD/JPY Analysis Today
· The Euro started a fresh

Dollar Gains After CPI: USD/JPY and USD/CAD Test Resistance
The US dollar strengthened following the release of stronger-than-expected inflation data, which reinforced expectations that the Federal Reserve will maintain a restrictive monetary policy stance. US consumer prices rose to their highest levels since May 2023, renewing concerns over persistent

XRP/USD: Consolidation Amid Regulatory Expectations
Fundamental Background
The key event for XRP in May remains the fate of the CLARITY Act, which is expected to establish XRP’s status as a digital commodity at the federal level. According to CoinMarketCap, the Senate Banking Committee has