


BTCUSD and XRPUSD Technical Analysis – 26th APR 2022
FXOpen

BTCUSD: Double Bottom Pattern Above $38,000
Bitcoin was not able to sustain its bullish momentum last week, and after touching a high of $42,901 on April 21st, started to decline heavily against the US dollar.
The shortselling continued pushing down the price of BTC below the $39,000 handle, after which we saw some consolidation.
A falling trend channel is forming on the chart, expected to push down the price of bitcoin below the $38,000 handle. We can also see a double bottom pattern above the $38,000 handle — which is a bullish reversal pattern because it signifies the end of a downtrend and a shift towards an uptrend.
The Stoch and Williams percent range are indicating an overbought level, meaning that in the immediate short term, a decline in the price is expected.
The relative strength Index is at 61 indicating a STRONG demand for bitcoin at the current market levels.
Bitcoin is now moving above its 100 hourly SMA and its 200 hourly exponential MA.
Most of the major tech indicators are giving a BUY signal, which means that in the immediate short term, we are expecting targets of $42,000 and $43,000.
The average true range is indicating LESSER market volatility with a strong bullish momentum.
- Bullish reversal seen in bitcoin above $38,000
- The StochRSI is indicating an OVERSOLD level
- The price is now trading just above its pivot levels of $40,429
- All of the moving averages are giving a BUY market signal
Bitcoin: Bullish Reversal Seen Above $38,000

Bitcoin has moved out of the falling trend we observed last week and now continues to consolidate its gains above the $40,000 handle in the European trading session. The bounce that we have seen above the $38,000 handle is expected to continue this week, and we are now looking at the targets of $42,000 and $45,000 in the medium-term range.
The immediate short-term outlook for bitcoin is bullish; the medium-term outlook has turned bullish; the long-term outlook remains neutral under present market conditions.
We are now looking at possible reversal and short selling at $40,500 and $40,450, as indicated by the MA5 and MA10 crossover pattern. This is further validated by the overbought level seen in the Stoch and Williams percent range.
The price of BTCUSD is now facing its classic resistance level of $40,514 and Fibonacci resistance level of $40,627 after which the path towards $42,000 will get cleared.
In the last 24hrs, BTCUSD has gone UP by 4.83% with a price change of 1859$, and has a 24hr trading volume of USD 32.922 billion. We can see an increase of 27.77% in the trading volume compared to yesterday, which is due to the buying by the medium-term investors.
The Week Ahead
The price of bitcoin touched an intraday high of $40,776 after which we saw some correction below the $40,500 handle.
We are now in the low volatility zone, and a surge in the price is expected leading to the increase in volatility levels.
The on-chain analysis is predicting a short-term rally towards the $45,000 handle this week.
The current market condition is suitable for entering into a BUY position with targets of $43,000 and $45,000 for next week.
This week, the price of BTCUSD will need to remain above the important support level of $40,000.
The weekly outlook is projected at $43,000 with a consolidation zone of $42,500.
Technical Indicators:
The moving averages convergence divergence (12,26): at 252.30 indicating a BUY
The average directional change (14-day): at 51.53 indicating NEUTRAL levels
Bull/Bear power (13-day): at 115.78 indicating a BUY
The relative strength index: at 61 indicating a BUY
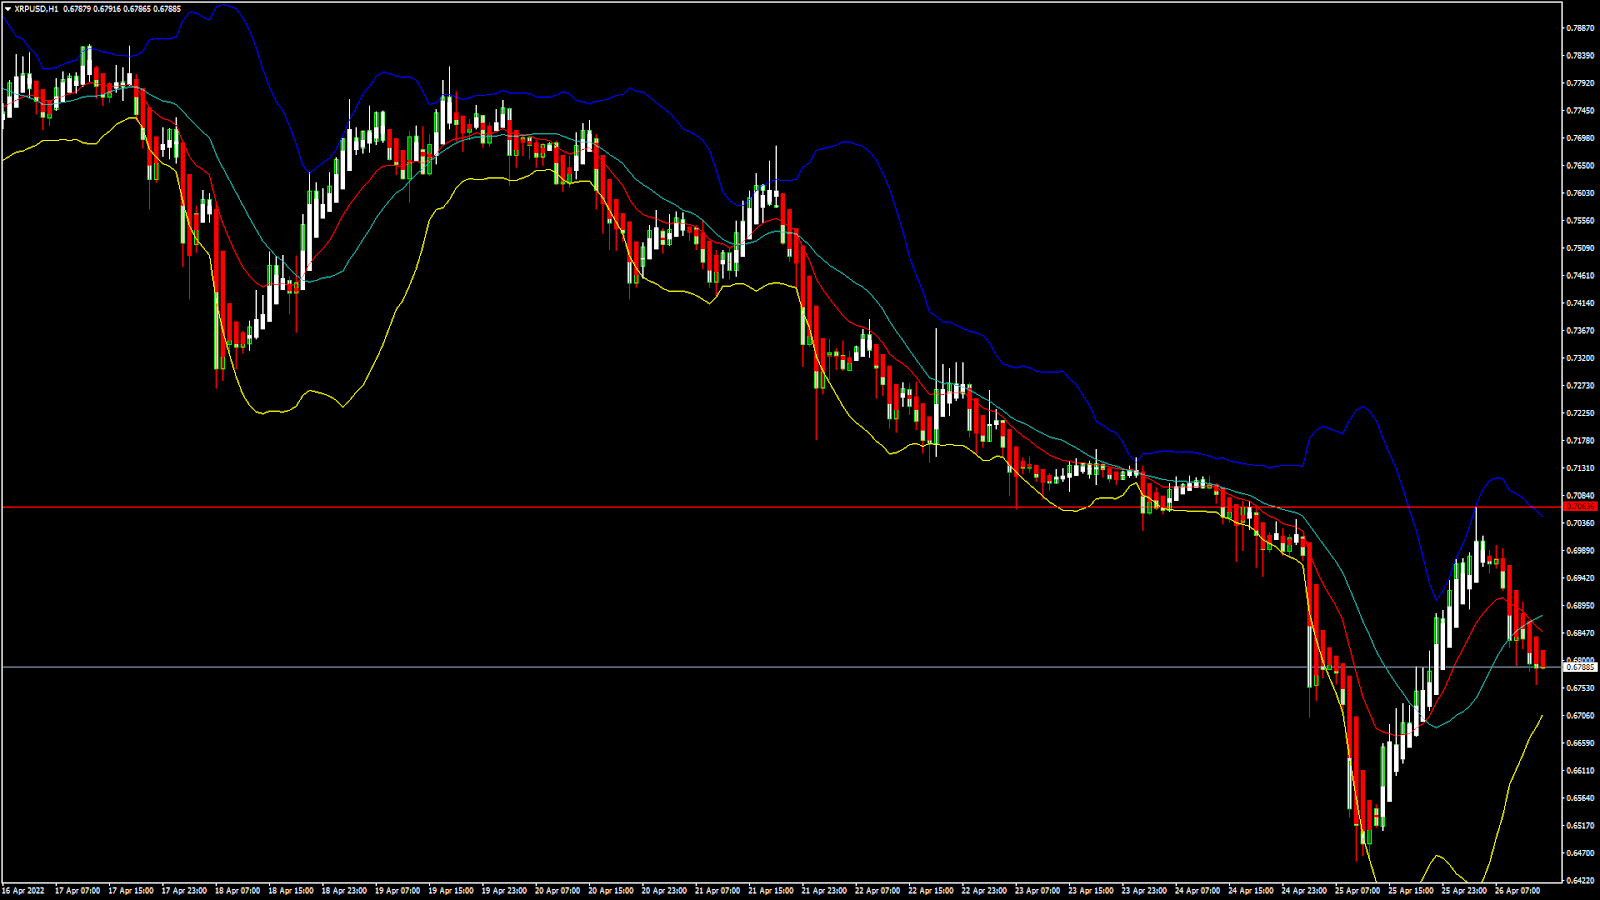
XRPUSD: Descending Triangle Pattern Below 0.7000
Ripple was unable to sustain its bullish momentum last week, and after touching a high of 0.7058 on April 26th, started to decline touching a low of 0.6759 in today’s European trading session.
The ongoing US-SEC case against Ripple Labs will take longer than expected and is supposed to end in the year 2023, which continues to put pressure on XRP in the long-term. The delay is causing some of the long-term investors to liquidate their holdings and push down the price below the 0.7000 handle.
We can clearly see a descending triangle pattern below the 0.7000 handle which signifies the end of an uptrend and a shift towards a downtrend.
The short-term outlook for Ripple has turned strongly bearish; the medium-term outlook is bearish; the long-term outlook is neutral under present market conditions.
The relative strength index is at 44 which signifies a WEAK demand for Ripple at the current market prices, and the continuation of the bearish momentum.
All of the moving averages are giving a STRONG SELL signal at the current market level of 0.6791.
Ripple is now trading below its pivot level of 0.6806. It is facing its classic support level of 0.6718 and Fibonacci support level of 0.6785, after which the path towards 0.6500 will get cleared.
- All of the major technical indicators are giving a STRONG SELL signal
- Bearish reversal seen in Ripple below 0.7000
- The Williams percent range and StochRSI are indicating an OVERSOLD level
- The average true range indicates LESSER market volatility
Ripple: Bearish Reversal seen Below 0.7000
In today’s European trading session, Ripple has been moving in a strongly bearish momentum below the level of 0.7000. We can see a bearish doji pattern below said level which further validates the bearish outlook for Ripple in the medium-term range.
XRP touched a high of 0.7058 in the Asian trading session, after which the prices started falling and are ranging below the 0.6700 handle.
The price of XRPUSD has gone UP by 4.11% with a price change of $0.02699 in the past 24hrs, and has a trading volume of 1.987 billion USD.
We can see a 5.87% increase in the trading volume of Ripple as compared to yesterday, which appears to be normal.
The Week Ahead
The price of XRPUSD is now moving in a strongly bearish momentum below the 0.6800 handle, and the next visible targets are 0.6500 and 0.6200.
Ripple is now trading in a falling demand zone formation; we are looking at the possible targets of 0.6400 and 0.6000 for next week.
Next week, Ripple is expected to enter into a consolidation channel above the 0.6000 handle.
The weekly outlook for Ripple is projected at 0.6600 with a consolidation zone of 0.6400.
Technical Indicators:
The moving averages convergence divergence (12,26): at -0.001 indicating a SELL
The ultimate oscillator: at 39.03 indicating a SELL
The commodity channel index (14-day): at -134.33 indicating a SELL
Bull/Bear power(13-day): at -0.0100 indicating a SELL
FXOpen offers the world's most popular cryptocurrency CFDs*, including Bitcoin and Ethereum. Floating spreads, 1:2 leverage — at your service (additional fees may apply). Open your trading account now or learn more about crypto CFD trading with FXOpen.
*Important: At FXOpen UK, Cryptocurrency trading via CFDs is only available to our Professional clients. They are not available for trading by Retail clients. To find out more information about how this may affect you, please get in touch with our team.
This article represents the opinion of the Companies operating under the FXOpen brand only. It is not to be construed as an offer, solicitation, or recommendation with respect to products and services provided by the Companies operating under the FXOpen brand, nor is it to be considered financial advice.
Stay ahead of the market!
Subscribe now to our mailing list and receive the latest market news and insights delivered directly to your inbox.


Latest articles

Ethereum: Has the Recovery Begun?
Ethereum has staged a notable rebound after once again testing the heavily watched psychological zone around 1500$. Since bouncing off this support, ETH/USD has climbed roughly 13%, now trading around the $1,700 mark.
This recovery is being driven

Oil Prices Are Back at Pre-Conflict Levels. Analysts Are Divided
At the start of May, oil markets were still pricing in elevated geopolitical risk and expectations of sustained supply disruption.
But easing tensions between Washington and Tehran, along with improving supply expectations, have rapidly shifted sentiment back toward fundamentals.
📉 Brent

The Dollar Awaits the Week’s Key Report: AUD/USD and NZD/USD at Crucial Technical Levels
Following mixed performance by the US dollar earlier this week, investors are now fully focused on the June Nonfarm Payrolls report, which will be released on Thursday rather than Friday. The schedule has been brought forward as US financial markets