


FXOpen
The Euro and British Pound declined heavily this week against the Japanese Yen. Both EUR/JPY and GBP/JPY are currently consolidating losses, and may perhaps struggle to recover substantially.
Important Takeaways for EUR/JPY and GBP/JPY
- After a major decline, the Euro found support near 127.75 against the Japanese Yen.
- There is a major resistance forming near the 128.60 level.
- GBP/JPY is struggling to recover and it remains at a risk of more declines below 145.60.
- Tokyo’s Consumer Price Index increased 0.4% in May 2018 (YoY), less than the forecast of +0.5%.
EUR/JPY Technical Analysis
The Euro struggled to move above the 131.40 and 131.50 resistance levels against the Japanese Yen. As a result, the EUR/JPY pair declined sharply and broke many supports such as 130.00 and 129.20.
The pair even broke the 128.00 level and settled below the 50 hourly simple moving average. A low was formed near 127.75 before buyers appeared. An upward correction was initiated and the pair moved above the 128.00 resistance.
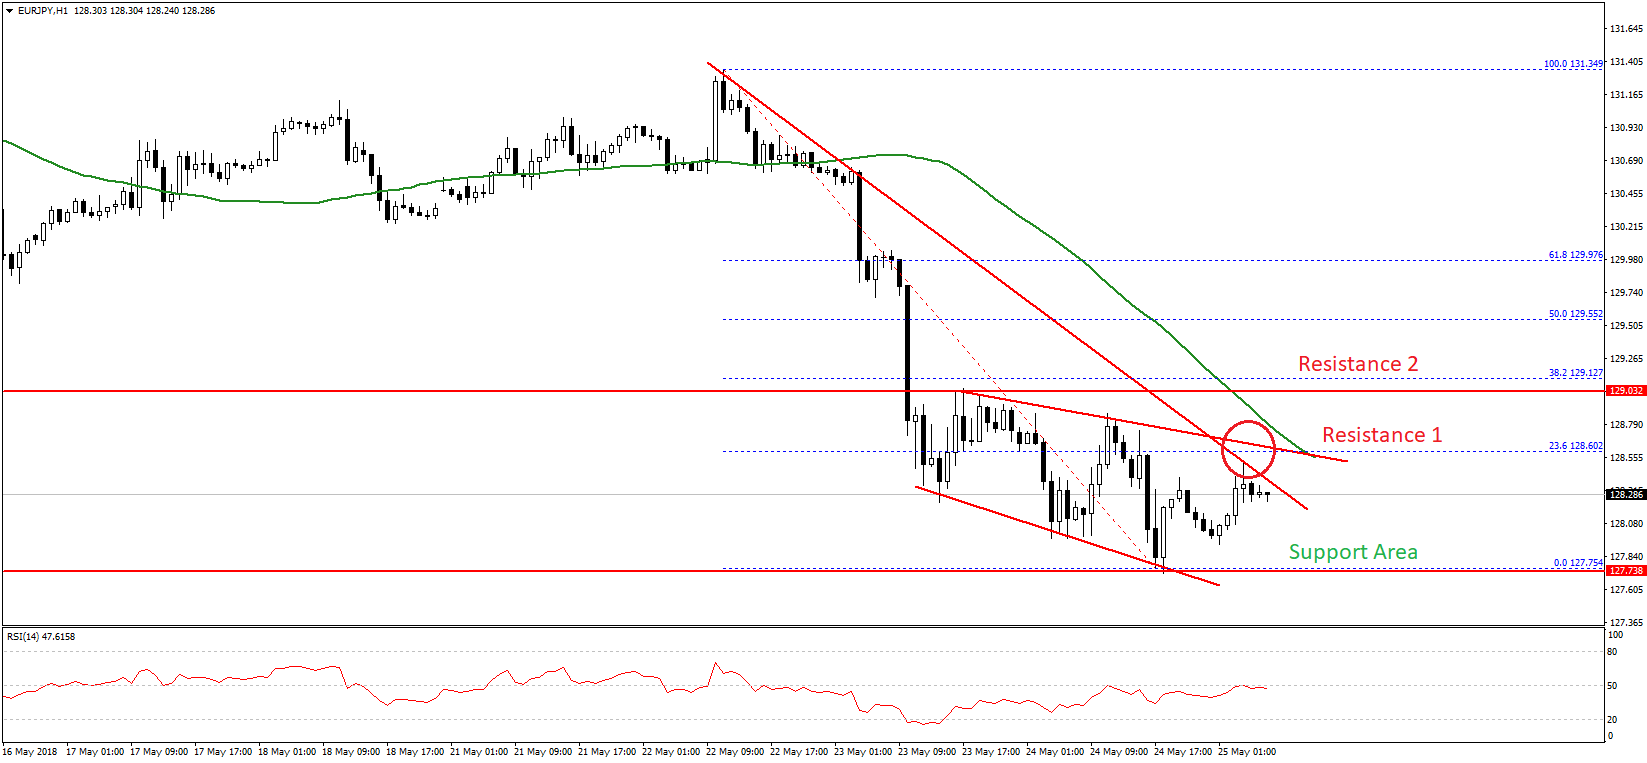
However, the upside move was capped by a crucial bearish trend line with current resistance at 128.35 on the hourly chart of EUR/JPY. Moreover, the 23.6% Fib retracement level of the last decline from the 131.34 high to 127.75 low also acted as a hurdle for buyers.
Looking at the chart, it seems like there are two key resistances formed at 128.60 and 129.20. Therefore, a break and close above the stated resistances is required for a decent recovery above 130.00 in the near term.
If the Euro buyers fail to push the pair above 128.60 and 129.20, EUR/JPY could resume its downtrend towards 127.75 and 127.50.
Today, the German IFO business sentiment index for May 2018 will be released by the CESifo Group. The forecast is slated for a minor decline from 102.1 to 102.00. If the result disappoints, the Euro may come under a short-term bearish pressure.
GBP/JPY Technical Analysis
The British Pound followed a similar declining pattern and fell from the 149.70 swing high against the Japanese Yen. The GBP/JPY pair tumbled and broke the 148.00 and 146.00 support levels.
A low was formed at 145.69 before the pair started an upside correction. At the moment, the pair is facing a key barrier at 146.70 and a bearish trend line on the hourly chart.
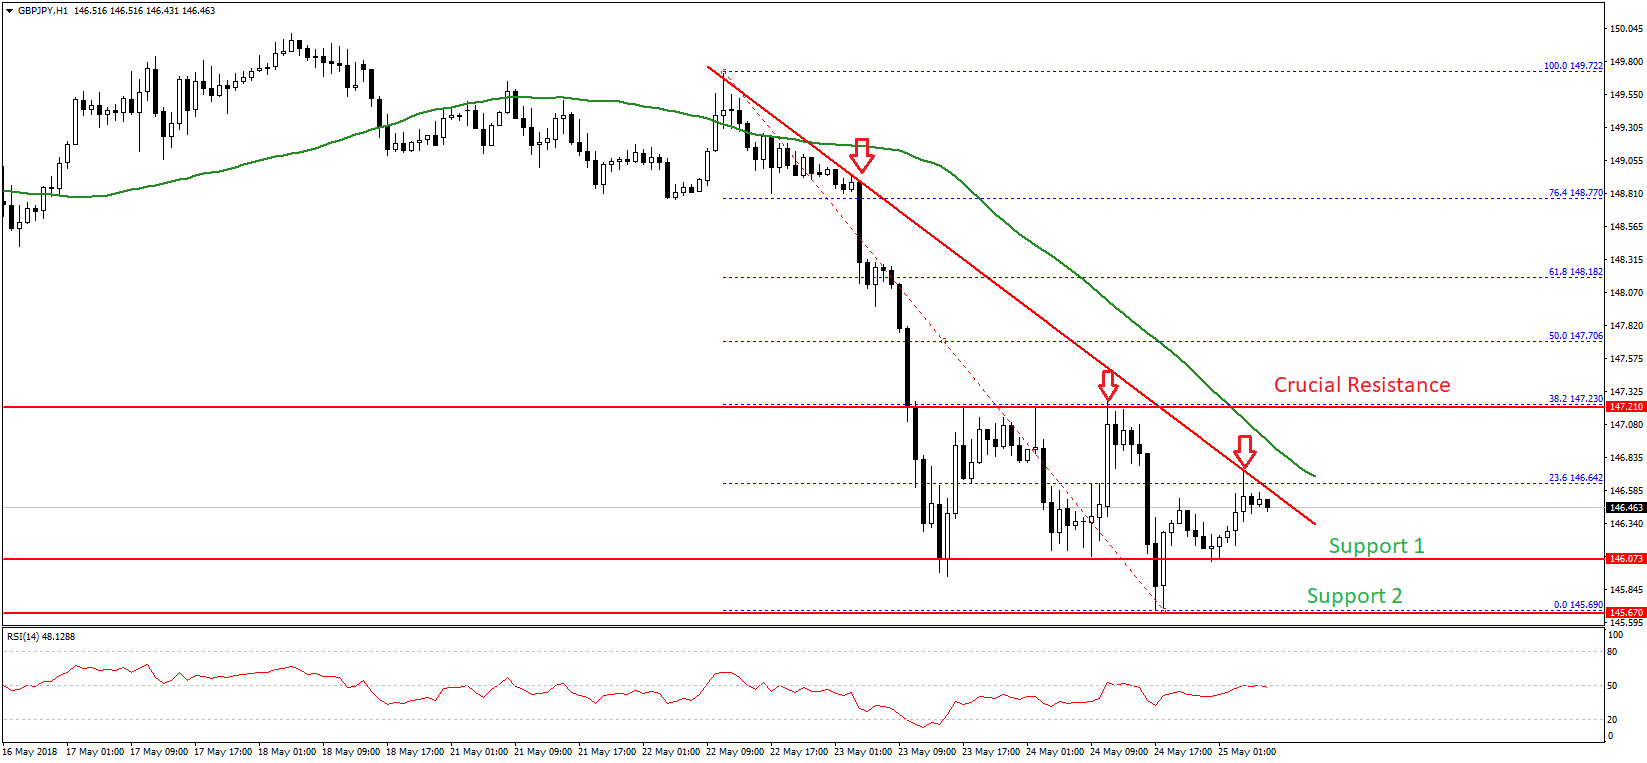
Furthermore, the 23.6% Fib retracement level of the last drop from the 149.72 high to 145.69 low is also near the 146.65 level to prevent further recoveries. A push above the 146.65-70 resistance may perhaps push the pair towards the all-important 147.20 barrier.
The GBP/JPY pair must breach the stated 147.20 barrier for a substantial recovery towards 149.00 in the near term.
On the other hand, if there is no upside break above 146.70 and 147.20, the pair could decline once again. On the downside, supports are seen at 146.00 and 145.70.
Today in Japan, Tokyo’s Consumer Price Index for May 2018 was released by the Statistics Bureau. The market was looking for a rise of 0.5% in the CPI compared with the same month a year ago.
However, the actual result was a bit lower as Tokyo’s Consumer Price Index increased 0.4%. Moreover, the Tokyo Consumer Price Index ex Fresh Food increased 0.5%, less than the forecast of 0.6%.
Trade over 50 forex markets 24 hours a day with FXOpen. Take advantage of low commissions, deep liquidity, and spreads from 0.0 pips. Open your FXOpen account now or learn more about trading forex with FXOpen.
This article represents the opinion of the Companies operating under the FXOpen brand only. It is not to be construed as an offer, solicitation, or recommendation with respect to products and services provided by the Companies operating under the FXOpen brand, nor is it to be considered financial advice.
Latest from Forex Analysis
Latest articles

Google Share Price Rose Post-market to a New All-time Record
Yesterday, after the close of the main trading session, a report on activities for the 1st quarter of Alphabet Inc. (Google's parent company) was published. The report was strong, exceeding investors' expectations.
→ Quarterly EPS = USD 1.89 (expected = USD 1.

S&P 500 Rebounds after Negative GDP News
Data released yesterday showed US GDP growth slowed to 1.6% in the first quarter of the year. According to ForexFactory: forecast = 2.2%, past value = 2.4%.
Reaction to the news sent the S&P 500 mini stock
GBP/USD And USD/CAD Daily Chart Outlook
GBP/USD is attempting a recovery wave from 1.2300. USD/CAD is consolidating and might aim for a move above the 1.3760 resistance zone.
Important Takeaways for GBP/USD and USD/CAD Analysis Today
· The British Pound started