


Crab Pattern Trading
FXOpen

Are you looking to add harmonic patterns to your trading arsenal? You can try the Crab pattern. In this article, we’ll explore the basics of Crab patterns, the key rules and requirements you should be aware of, and learn how to use this versatile tool across all markets.
About the Crab Pattern
The Crab pattern is a harmonic pattern used in technical analysis to identify potential reversal points in financial assets. While harmonic patterns date back decades to H. M. Gartley’s 1935 book, Profits in the Stock Market, the Crab is a relatively new innovation developed by Scott M. Carney in 2000.
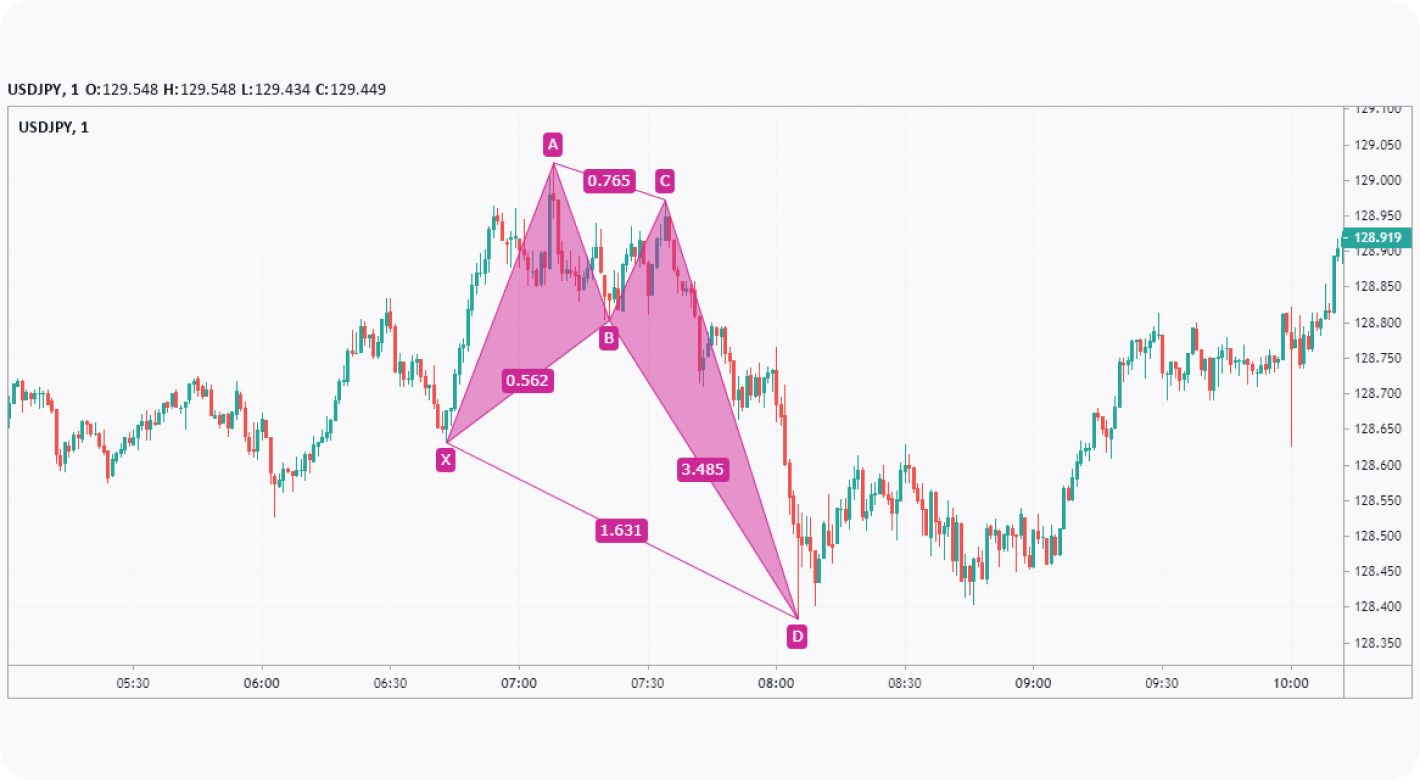
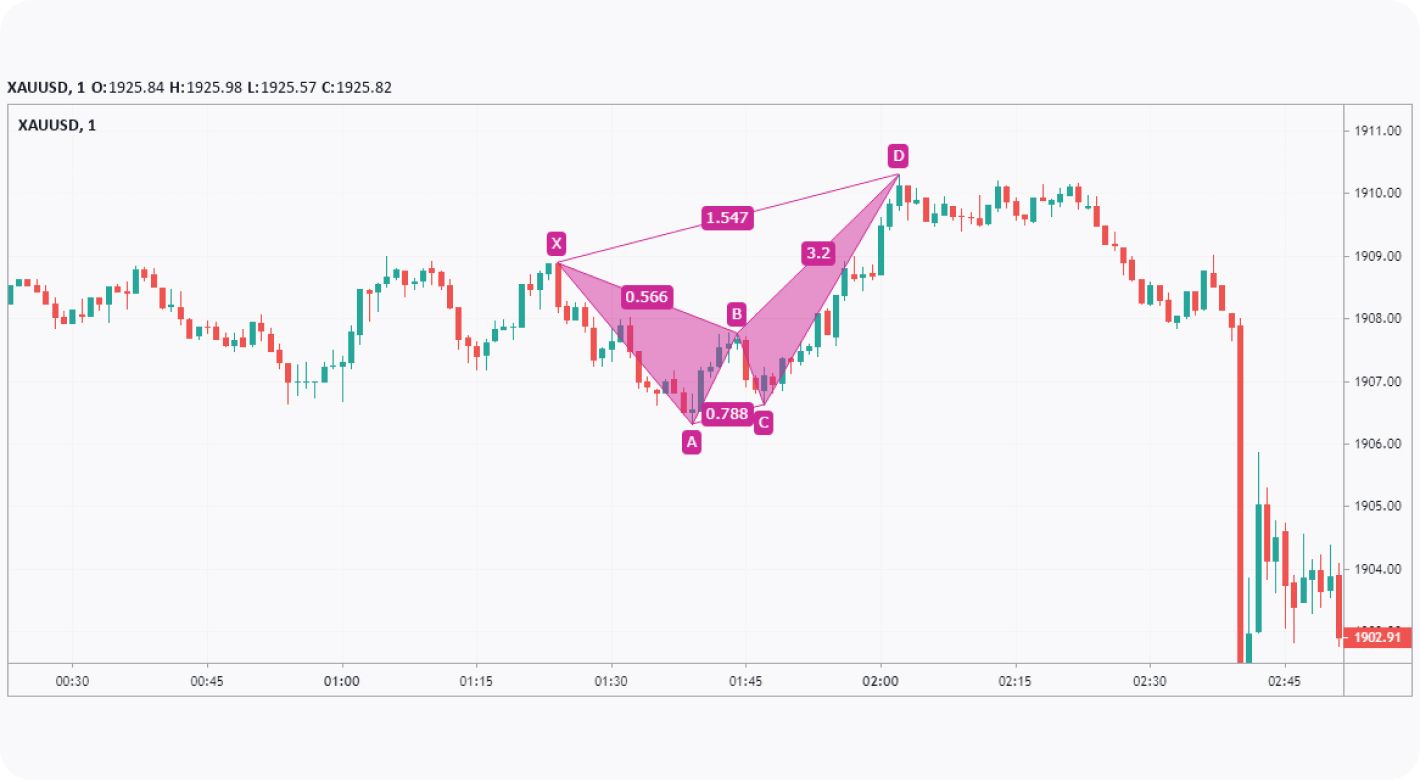
The Crab pattern is identified by specific Fibonacci ratios and consists of five distinct swings that are labelled as points X, A, B, C, and D. Point X is the starting position of the pattern, while point D is the potential reversal area. Notably, one of the hallmarks of the Crab is its long CD leg, as you’ll see shortly.
Despite being one of the rarer harmonic patterns, many traders successfully apply the Crab to markets, like stocks, commodities, forex, and crypto*, to create high-risk/reward setups. Traders typically use the pattern in combination with other forms of technical analysis, like trendlines, chart patterns, and indicators, to confirm potential reversal points.
How to Identify the Crab Pattern When Trading
Like other harmonic patterns, the Crab requires that a specific set of rules are met before being considered valid to trade. The essential Crab pattern rules are:
- X forms at a high or low.
- A is formed at an opposing high or low, i.e., if X is a high, then A is a low, and vice versa. This movement is known as the XA leg.
- The price retraces XA between 0.382 and 0.618 to produce B, creating the AB leg.
- C retraces 0.382 to 0.886 of the AB leg and generates a BC leg.
- D forms at a 1.618 extension of the XA leg, creating the final CD leg, and should ideally be a 2.24 to 3.618 extension of the BC leg.
- Traders enter at D.
Note that the ratios won’t always line up perfectly, so use your judgement to determine whether the pattern is valid. The ratios are simply guidelines to identify potential Crabs. It’s always best practice to use your discretion and consider other technical factors to decide whether you want to enter a trade based on your observations of the Crab formation.
As you dive deeper into the world of harmonic patterns, you might notice that the Crab and Butterfly look very similar. The difference is in their internal retracements and, most importantly, the depth of D. The Butterfly requires that D be a 127% to 161.8% extension of XA, while the Crab will always be a 161.8% extension of XA.
Trading the Crab Pattern
Now that we understand how to identify Crabs, it’s time to start looking at how traders typically employ the Crab to enter trades. We’ll be using the TickTrader platform to demonstrate how you can use this pattern, and if you’d like to follow along, feel free to use it as well. There’s no need to sign up to FXOpen, and you’ll be able to start honing your Crab identification skills within seconds. You can also open an FXOpen account if you want to practise the Crab in live markets.
The Bullish Crab Harmonic Pattern Strategy
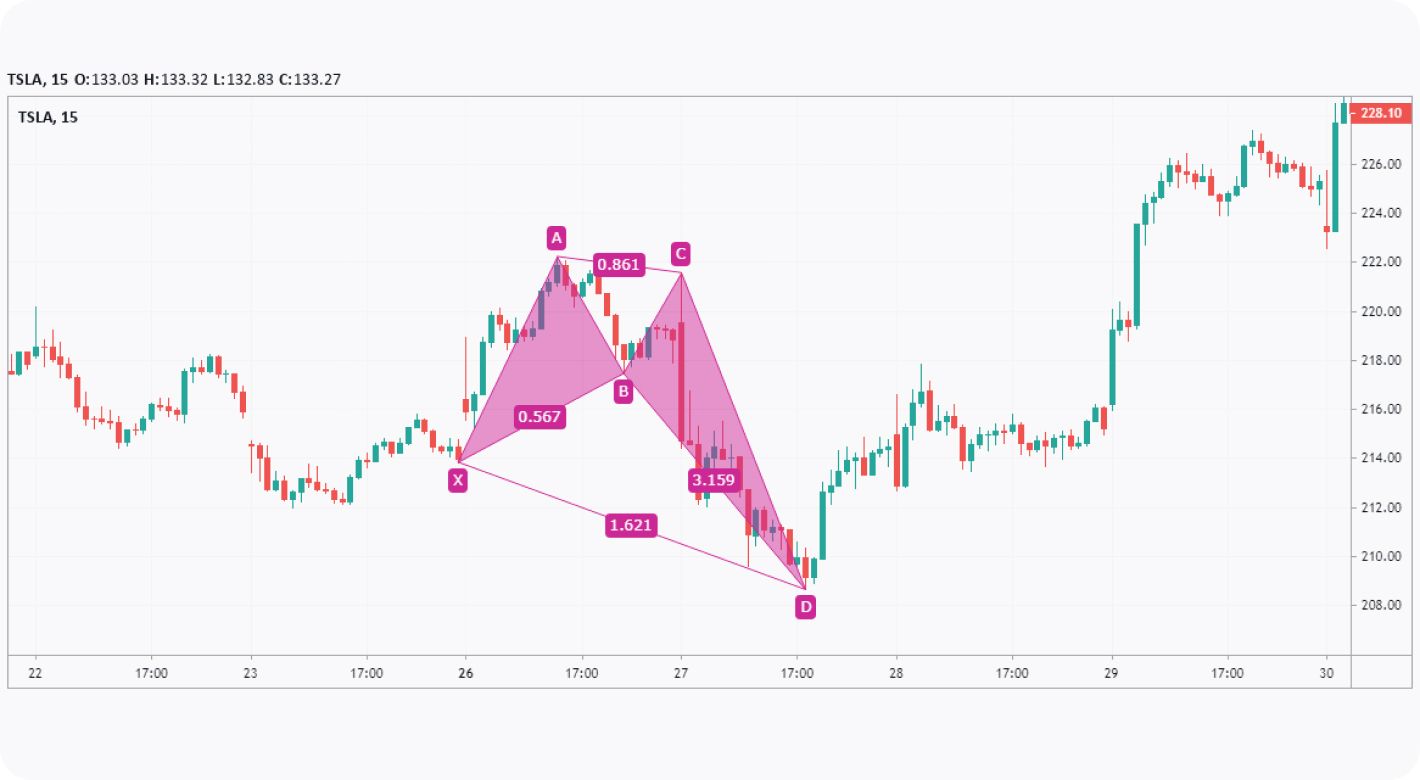
Let’s briefly cover the exact rules for a bullish Crab pattern in the forex, stock, commodities, and currency markets. They are:
- XA Leg: The XA leg comprises a low X and a high A.
- AB Leg: B is a bearish move that retraces between 0.382 and 0.618 of XA.
- BC Leg: Another high, C, forms, which is a 0.382 to 0.886 retracement of AB.
- CD Leg: A sharp move down creates D, which is a 1.618 extension of XA and, ideally, a 2.24 to 3.618 extension of BC.
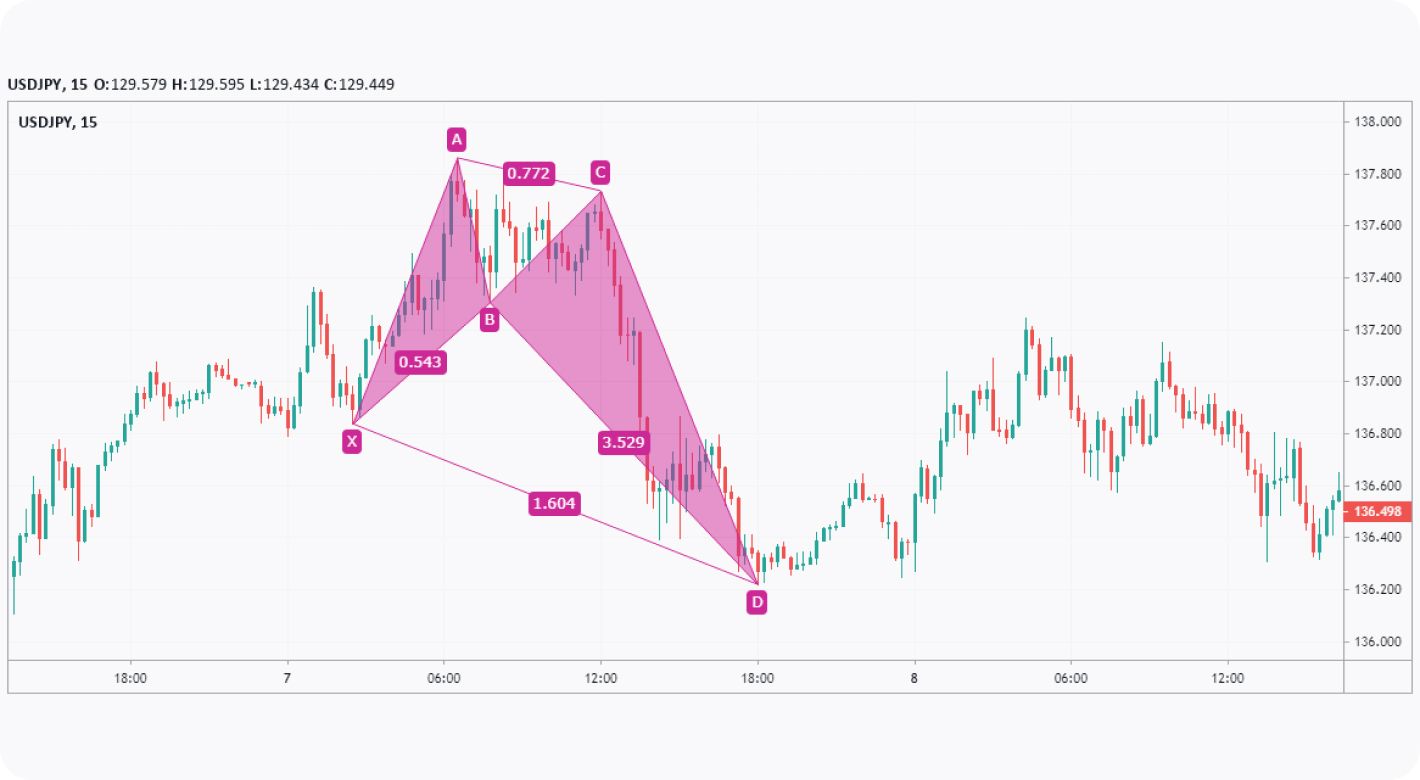
Traders will either set a limit order at a projected point D or wait for the price to show signs of reversal before entering with a market order. It can be tricky to know at which point the Crab becomes invalid if D continues past the 1.618 mark, so you may try setting a hard limit, like 1.7, at which point you consider it untradeable.
Stop losses are typically placed just below D. Traders often use a set number of pips or a volatility-based indicator, like Average True Range or Bollinger Bands, to find an appropriate point. Alternatively, you could try using a set limit that would invalidate the entire pattern for your stop loss.
Profit targets depend on how conservative your trading style is. Some traders prefer to begin banking profits once A is reached, while others start taking partials at B. For longer-term targets, a 1.618 extension of A and D is also commonly utilised.
The Bearish Crab Harmonic Pattern Strategy
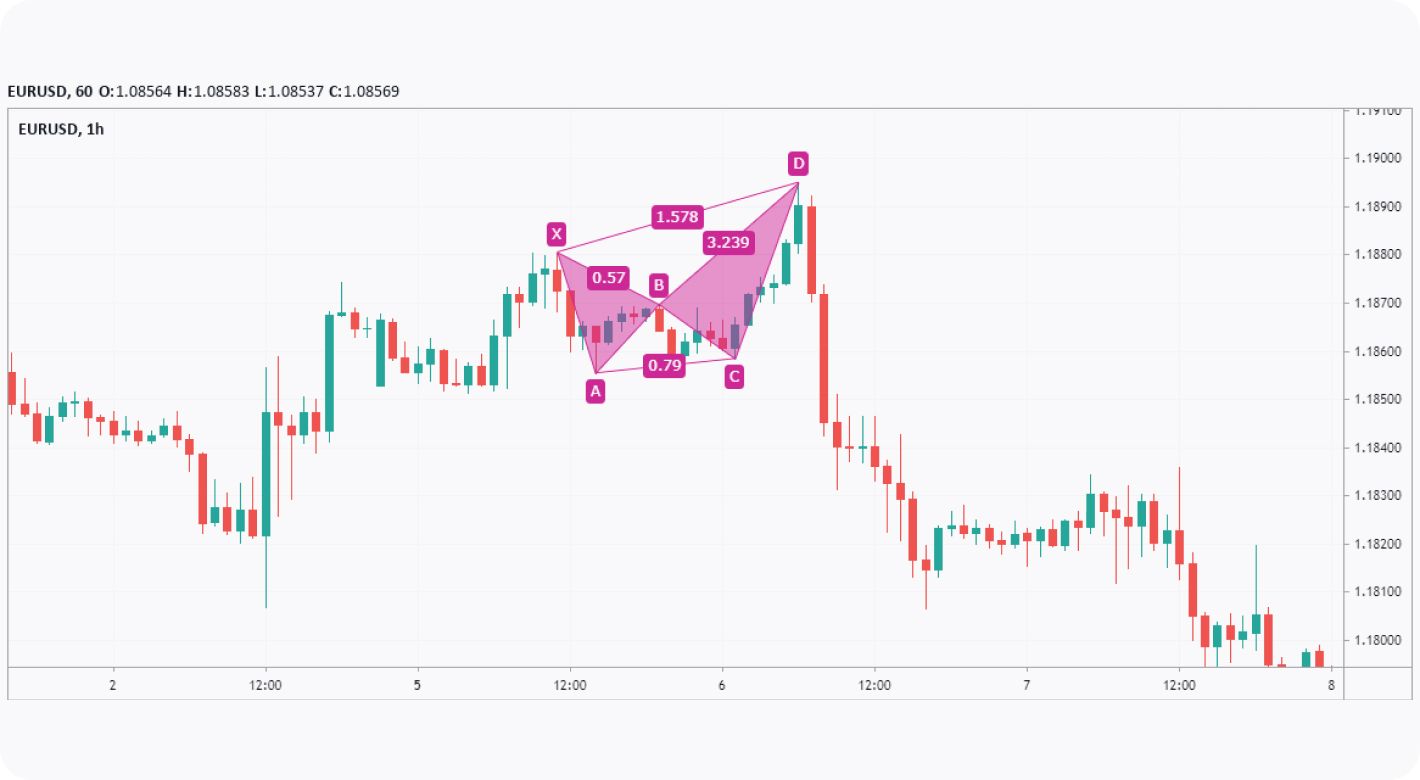
The principles for a bearish Crab pattern are primarily the same, just flipped. As such:
- XA Leg: The XA leg features a high X and low A.
- AB Leg: A bullish move creates B, retracing 0.382 and 0.618 of XA.
- BC Leg: The price falls to produce C, a 0.382 to 0.886 retracement of AB.
- CD Leg: A spike upward generates D, which extends XA by 1.618 and should extend BC by 2.24 to 3.618.
Similarly, traders enter at D, either with a limit order prior to the point forming or with a market order once bearish price action confirms the formation.
Stop losses are usually placed just above D, although it’s up to you how you choose to determine the precise point. Just be wary of using a stop loss that’s too wide.
Likewise, traders often begin taking profits at A or B, with the 1.618 extension of A and D offering a suitable target beyond the range of the pattern.
What to Do Next
All that’s left to do is to keep practising and training your eyes to recognise potential Crab patterns. You can follow these steps if you want to improve your ability to spot Crab formations while forex trading, and start incorporating them into your strategy:
- Practise identifying Crabs on historical charts.
- Try using software that automatically identifies and labels Crab patterns for you, so you can focus on analysing their formation.
- Open an FXOpen account and try trading the patterns as you see them occurring.
- Experiment with indicators and other forms of technical analysis to create a viable strategy.
*At FXOpen UK, Cryptocurrency CFDs are only available for trading by those clients categorised as Professional clients under FCA Rules. They are not available for trading by Retail clients.
This article represents the opinion of the Companies operating under the FXOpen brand only. It is not to be construed as an offer, solicitation, or recommendation with respect to products and services provided by the Companies operating under the FXOpen brand, nor is it to be considered financial advice.
Stay ahead of the market!
Subscribe now to our mailing list and receive the latest market news and insights delivered directly to your inbox.


Latest articles

GBP/CHF: Trendline or RSI — Which One Is Lying?
Sterling enters this week on firmer footing, with political uncertainty fading fast after Andy Burnham's confirmation as Labour leader eased investor concerns over the succession to Keir Starmer. Markets reacted further to reports pointing to Shabana Mahmood as the frontrunner

Silver Attempts to Break Out of Its Range
Silver continues to balance between its dual role as an industrial metal and so-called refuge asset, and this combination largely explains the lack of a clear trend in recent weeks. Shifting expectations for central bank interest rates can influence the

Nasdaq 100: Is This the Correction Traders Have Been Waiting For?
The Nasdaq 100 (US Tech 100 Mini on FXOpen) remains caught between two opposing forces: cooling inflation on one side, and persistent geopolitical instability on the other. On 14 July, June's CPI print came in softer than expected, easing near-term