


The Butterfly Pattern: Idea and Application
FXOpen

The butterfly pattern is one of the most recognised harmonic formations in technical analysis. Built around Fibonacci ratios, it provides traders with a structured way to spot potential market reversals. Unlike some patterns that complete within an initial price swing, the butterfly extends beyond it, often marking areas of exhaustion.
This article breaks down the idea and application of the butterfly pattern in trading, explaining its structure, uses, strengths, and how it compares with related patterns.
What Is the Butterfly Pattern?
The butterfly pattern is a harmonic reversal pattern built around Fibonacci measurements. Traders look for it when price forms a specific four-leg sequence, labelled X-A, A-B, B-C, and C-D. Unlike some harmonic patterns that complete within the original range, the butterfly extends beyond the starting point, making it distinct.
The pattern was first identified by Bryce Gilmore and later popularised by Scott Carney, who detailed the precise Fibonacci ratios that define it. Because the butterfly depends on exact Fibonacci relationships, it provides a structured framework rather than guesswork. Still, it is usually combined with other forms of analysis, since the market doesn’t always respect ratios in isolation.
There are both bullish and bearish versions. A bullish butterfly forms at the end of a downtrend, while a bearish one appears at the end of an uptrend. In both cases, traders watch the “D” point closely, as this is where reversals often start if the pattern is valid.
The Structure of the Butterfly Pattern
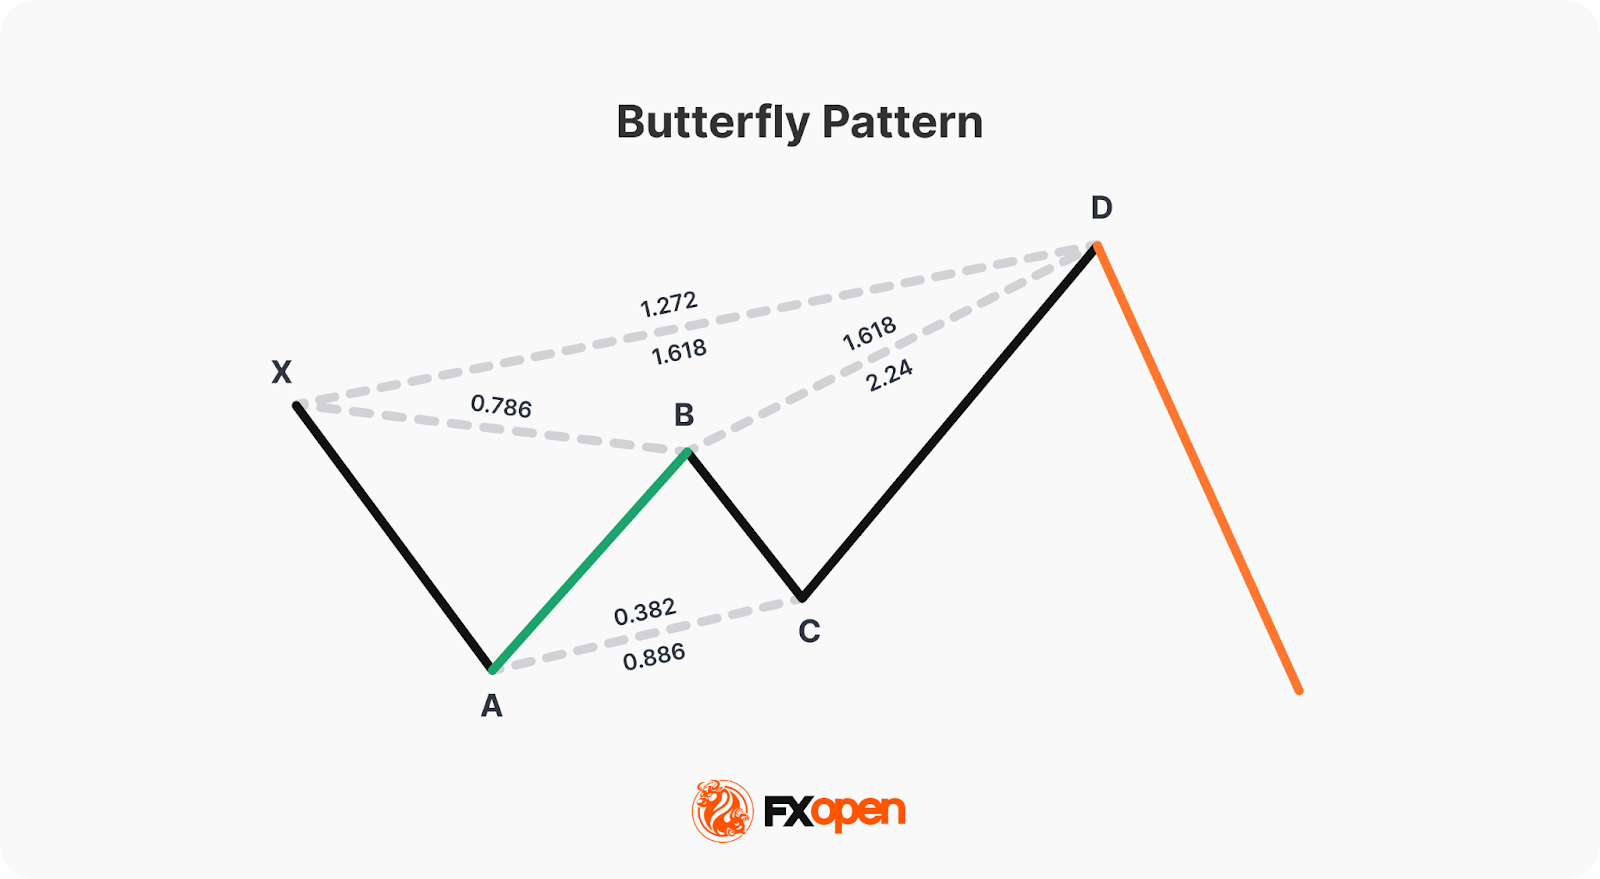
The butterfly chart pattern follows a strict structure built on Fibonacci ratios. Each leg has clear measurements, and without them, the pattern isn’t valid. Here’s how it breaks down:
- XA leg. This is the starting move, either up or down. It sets the foundation for the butterfly pattern on a chart.
- AB leg. AB retraces roughly 78.6% of the XA leg. This deeper retracement is one of the main features that separates the butterfly from similar harmonic patterns.
- BC leg. BC extends 38.2% to 88.6% of the AB leg. The exact depth varies, but it must stay within this range to keep the structure intact.
- CD leg. The CD leg is the defining element. It extends 161.8% to 261.8% of the BC leg, and at the same time, point D pushes beyond the starting point X. D should land between 127% and 161.8% of the XA leg, creating the “butterfly wing” shape.
Why does D matter? D is the potential reversal zone. If price reaches this level while respecting the ratios, traders view it as a high-probability area for the trend to turn.
Valid harmonic butterflies often look balanced. Uneven swings or distorted legs usually reduce reliability, since the pattern depends on measured ratios and visual harmony. You may consider using these rules to identify the butterfly pattern in stock, forex, and commodity CFD markets with FXOpen’s TickTrader platform.
Bullish vs Bearish Butterfly
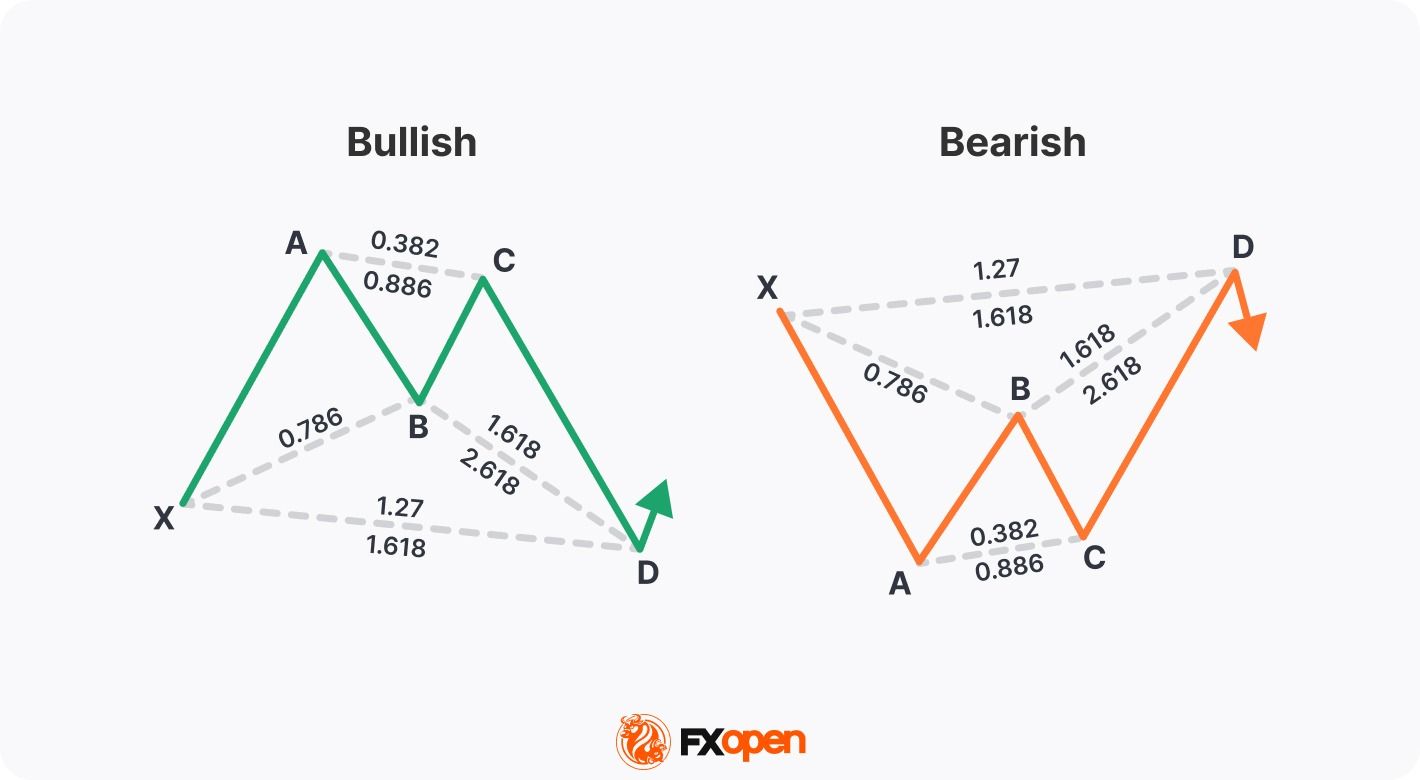
The butterfly pattern appears in two forms, depending on market direction:
Bullish Butterfly Pattern
- Forms at the end of a downtrend.
- The XA leg is a sharp rise with the pattern unfolding as price retraces and extends lower.
- Point D completes below the starting point X, marking a potential reversal zone where price may turn higher.
Bearish Butterfly Pattern
- Develops at the end of an uptrend.
- The XA leg is a strong fall, followed by retracements and extensions upward.
- Point D completes above X, signalling an area where price may reverse downward.
The structure is the same in both cases—the key difference is whether the setup points to exhaustion at the highs or at the lows.
Trading Rules for the Butterfly Pattern
Accuracy is critical with the harmonic butterfly pattern, since even small mistakes in measurement can make the setup invalid. Traders typically follow these steps to use the butterfly pattern in a trading strategy:
- Spotting the structure: They look for four clear swings on the chart.
- Applying Fibonacci ratios: Traders use the Fibonacci tool on each leg to confirm the required retracements and extensions. The pattern is only valid if these ratios line up correctly.
- Checking key conditions: Point C must not move beyond point A. If it does, the structure is invalid.
- Making an entry: Traders would look to enter at D using the defined ratios. They may look to confirm the reversal with a candlestick pattern, such as a pin bar, or an indicator.
- Defining levels: Points B, C and A could serve as profit objectives, while an extended point (e.g. the 190% extension of XA) beyond D could be treated as a stop level, since price moving past it invalidates the setup.
The general butterfly harmonic pattern rules are:
Applying the Butterfly Pattern in Market Analysis
The butterfly trading pattern gives structure to spotting potential turning points, but traders rarely treat it in isolation. Its value comes from combining the ratios with broader market context. Here’s how it’s typically applied:
- Identifying completion at point D.
The pattern is only considered complete when price reaches the projected D zone. Traders monitor this level closely, since it aligns with Fibonacci extensions that often mark exhaustion. Importantly, D isn’t a guaranteed reversal—it’s a zone worth watching.
2. Using confluence.
Traders often strengthen the analysis by looking for other signals lining up near point D. For example, if D overlaps with a long-term support or resistance level, round number, or a moving average cluster, the reversal gains weight. Confluence adds context to the Fibonacci levels.
3. Watching market behaviour.
Once price approaches D, the focus shifts to how the market reacts. A sharp rejection, slowing momentum, or confirming candlestick pattern gives traders more confidence that the butterfly is playing out. Without some form of reaction, many will consider the pattern incomplete or unreliable.
4. Aligning with broader analysis.
The butterfly is often cross-checked with trend analysis or higher timeframe structures. For example, spotting a bearish butterfly near a monthly resistance zone may be treated differently than one forming mid-trend with no context.
Strengths and Limitations
Like any technical formation, the butterfly pattern has advantages and drawbacks. Understanding both sides makes it clearer when the pattern is worth your attention and when caution is needed.
Strengths
- Objective rules: The butterfly is defined by strict Fibonacci ratios. This makes it less subjective than patterns based purely on visual interpretation.
- Clear invalidation: Point D provides a precise area where the pattern is considered complete. If price breaks well beyond it, the setup is invalidated, giving traders structure for managing exposure.
- Works across timeframes and markets: Whether on a five-minute chart or a weekly chart, the ratios remain the same. This flexibility allows traders to apply it in different styles, from intraday to swing trading. It is used across different markets too; traders can find the butterfly pattern in forex, stocks, commodities, and more.
- Signals potential exhaustion: Because the butterfly extends beyond the starting point X, it often marks stretched market conditions where reversals may become more likely.
Limitations
- Complex identification: With four legs and specific ratios, it’s easy to mislabel the swings. It may take a lot of practice to avoid confusing incomplete moves with correct patterns.
- Pattern failure in strong trends: When momentum is very high, price can ignore Fibonacci levels altogether, making reversals at point D less likely. For instance, applying the butterfly stock pattern to a chart just after the company reports strong earnings may mean it is less likely to work.
- Time-consuming development: The pattern requires multiple swings to form, so it doesn’t appear often. Traders who rely heavily on it may spend long periods waiting for setups.
- Confirmation still needed: On its own, the butterfly doesn’t guarantee reversals. Without broader context or additional signals, it can lead to false expectations.
Comparison with Other Harmonic Patterns
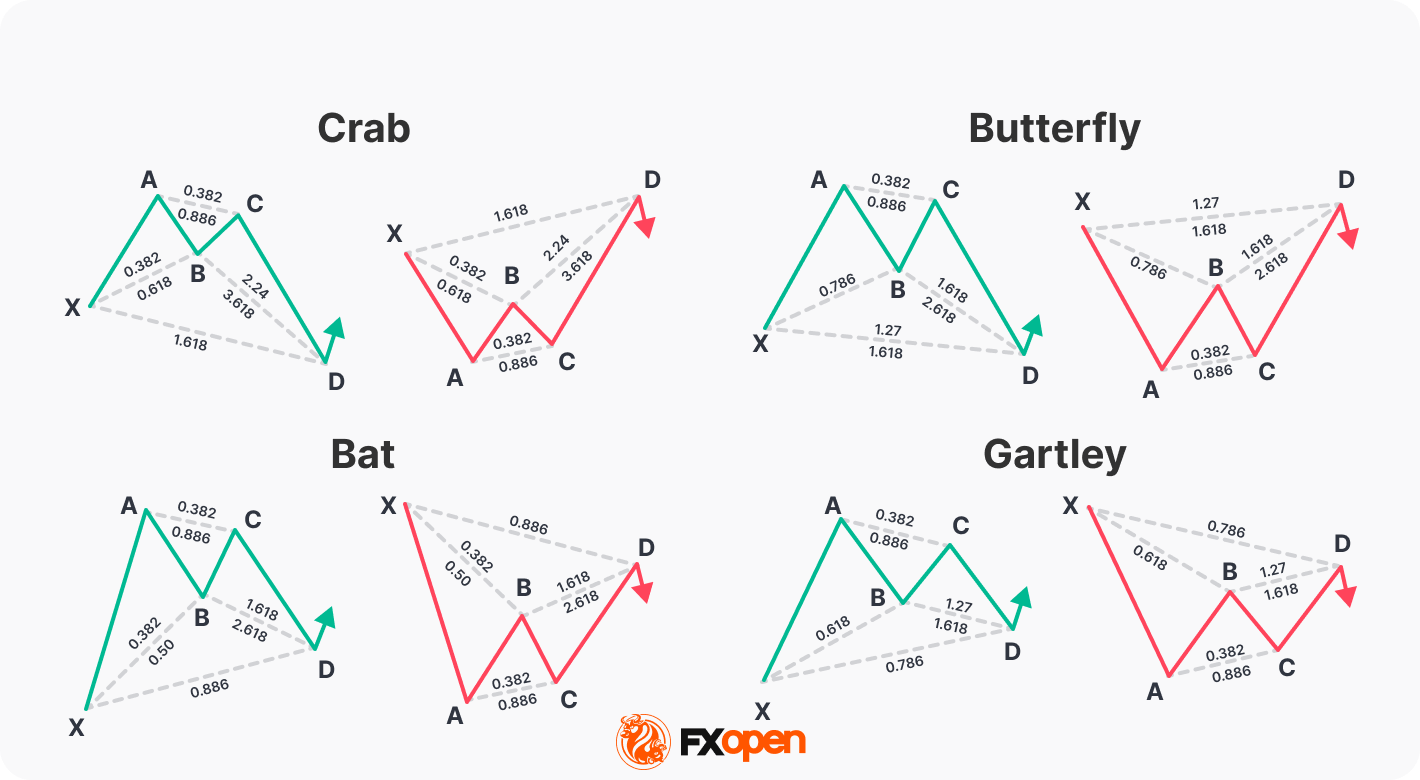
The butterfly pattern is one of several harmonic structures that traders analyse. While it shares similarities with others, there are key differences worth noting.
Gartley Pattern
The Gartley is a popular harmonic pattern. Unlike the butterfly, it completes within the original XA leg. Point D usually lands around the 78.6% retracement of XA, making it a shallower structure. The butterfly, in contrast, extends beyond X, highlighting deeper exhaustion.
Bat Pattern
The bat also stays within the XA range. Its defining feature is a smaller AB retracement, typically around 38.2% to 50% of XA. This makes the Bat more compact and less extended than the butterfly, which has a larger projection and a more aggressive reversal point.
Crab Pattern
The crab looks similar to the butterfly but has a much larger extension. Point D in the crab can stretch to 224%–361.8% of BC, far beyond the butterfly’s 161.8%–261.8% range. This makes the crab more extreme, often appearing in strongly extended markets.
In essence, the butterfly sits between the compact Gartley and bat, and the extreme crab, giving traders a structured middle ground for spotting potential reversals.
The Bottom Line
The butterfly pattern in technical analysis offers traders a structured way to analyse potential reversal zones with clear rules and measurable ratios. While it’s typically used alongside broader market analysis, its precision makes it a valuable addition to technical trading.
Those looking to apply harmonic patterns in live markets may consider opening an FXOpen account, where you can access advanced charting tools and put structured analysis like the butterfly into practice.
FAQ
What Is Butterfly Trading?
Butterfly trading is the practice of analysing the butterfly harmonic pattern across markets. It involves confirming Fibonacci ratios, identifying completion at point D, and monitoring price reaction. Traders use the butterfly pattern in stock markets, on forex charts, and with other assets to anticipate potential reversals, usually alongside other technical analysis tools.
What Does Butterfly Pattern Mean?
The butterfly pattern is a harmonic reversal structure built on Fibonacci ratios. It features four legs—XA, AB, BC, and CD—with point D extending beyond X, highlighting potential exhaustion and signalling where a trend reversal may develop.
How May Traders Apply the Butterfly Pattern?
Traders usually watch for the butterfly to complete at point D, then look for confirmation through price reaction or candlestick patterns. Profit objectives could be set near points B and A/C, while invalidation levels are usually placed beyond point D.
Which Butterfly Strategy Is the Most Popular?
No single approach fits all. The most common use typically combines the butterfly with wider market analysis. Confluence with support, resistance, or higher timeframe structures adds weight, while confirmation signals provide traders with more confidence than relying on Fibonacci ratios alone.
This article represents the opinion of the Companies operating under the FXOpen brand only. It is not to be construed as an offer, solicitation, or recommendation with respect to products and services provided by the Companies operating under the FXOpen brand, nor is it to be considered financial advice.
Stay ahead of the market!
Subscribe now to our mailing list and receive the latest market news and insights delivered directly to your inbox.


Latest articles

GBP/CHF: Trendline or RSI — Which One Is Lying?
Sterling enters this week on firmer footing, with political uncertainty fading fast after Andy Burnham's confirmation as Labour leader eased investor concerns over the succession to Keir Starmer. Markets reacted further to reports pointing to Shabana Mahmood as the frontrunner

Silver Attempts to Break Out of Its Range
Silver continues to balance between its dual role as an industrial metal and so-called refuge asset, and this combination largely explains the lack of a clear trend in recent weeks. Shifting expectations for central bank interest rates can influence the

Nasdaq 100: Is This the Correction Traders Have Been Waiting For?
The Nasdaq 100 (US Tech 100 Mini on FXOpen) remains caught between two opposing forces: cooling inflation on one side, and persistent geopolitical instability on the other. On 14 July, June's CPI print came in softer than expected, easing near-term