


Defining Triangular Patterns Using the Elliott Theory
FXOpen
Ralph Elliott built a trading theory based on human emotions like fear and greed and used different market cycles to explain the financial markets’ moves. He divided the market swings into waves, impulsive and corrective, that explain every upward or downward movement of a market.
Triangles in Elliott Wave Theory
The theory, built on the stock market price movement in the last part of the 1930’s, has the tremendous advantage that it can be applied on any financial instrument bound to the supply and demand law. Thus, currency traders in the 21st century successfully use the rules established by Elliott almost a century ago, to trade the foreign exchange market.
One of the basic rules of the theory says that traders should use numbers and letters to label impulsive and corrective waves. Therefore, whenever you see an Elliott Wave analysis and find numbers or letters, you will know that the analyst wanted to signal impulsive or corrective activity.
Among corrective waves, one pattern seems to dominate the theory. Especially on the currency market, this pattern forms so often that it is mandatory for traders to fully understand what Elliott had in mind when setting the rules of it. We talk about triangles, the most complex and, at the same time, enigmatic patterns in the Elliott Wave theory.
Explaining Triangular Patterns
As already mentioned, triangles form very often. Elliott found two broad categories: contracting and expanding ones.
Because the second category rarely appears on the currency market, we won’t focus on it here. Instead, we’ll explain how contracting triangles represent the key to understanding corrective waves with the Elliott Wave theory.
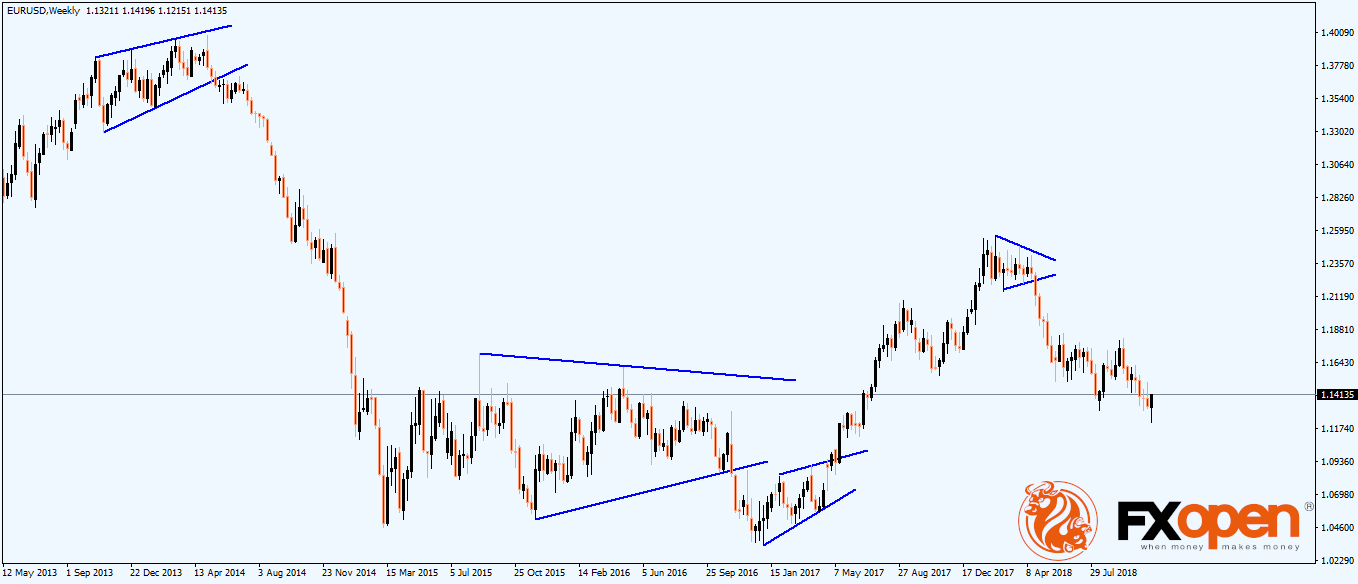
Here’s proof of how often the pattern forms. This is the EURUSD price action for the last years, with triangles forming everywhere.
In the Elliot Waves theory, triangles have a special place, forming either in the middle or the end of a complex correction or as the 4th wave in an impulsive move (also as the b-wave in a zigzag).
To understand triangles we must go back to the rules set by Elliott. He said that a triangular pattern has five segments, all of them corrective. Hence, the labeling of a triangle is a-b-c-d-e, with every segment being corrective.
A contracting triangle is a triangle that has the two trendlines (a-c and b-d) contracting towards a common point on the right side of the chart. Between the two, the b-d trendline is the most important one, as it defines the end of the triangular pattern.
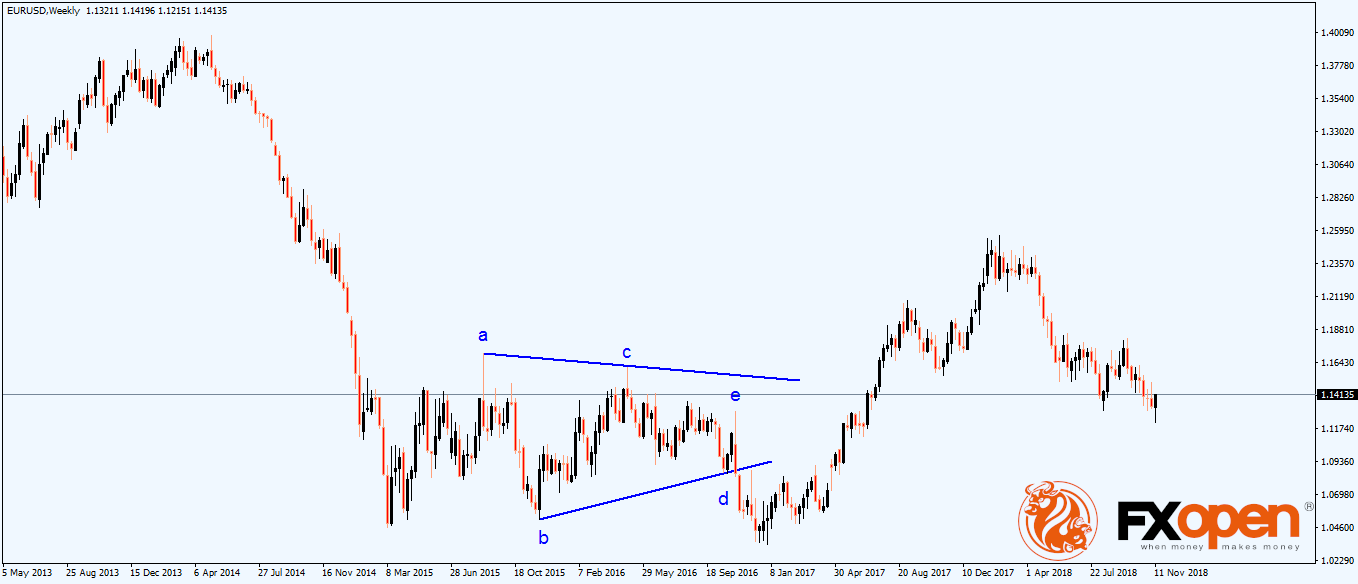
There’s one simple rule to use when interpreting a triangle. It uses the time element, and it refers to the breaking of the b-d trendline.
Elliott said that the price must break the b-d trendline in less time that it took the e-wave to form. Otherwise, that’s not a triangular pattern.
Therefore, traders measure the time taken by the e-wave (effectively counting the candlesticks) and project it on the right side of the chart to see what the price does. If the rule is respected, the triangle is in place and defines the Elliott count.
Most of the times the price retests the b-d trendline, being the favorite trading scenario for most retail traders. What they do is they go short (after a bearish triangle) on the b-d retest, place a stop-loss at the top of the e-wave and target a 1:2 or 1:3 risk-reward ratio. Or, they go long (after a bullish triangle), place a stop-loss at the bottom of the e-wave and set the same rr ratio.
Conclusion
Triangles are critical to the Elliott theory and appear almost everywhere. Literally, all patterns have at least a triangle in their structure, with double combinations being the most likely place to find a triangle in the Forex market.
This article represents the opinion of the Companies operating under the FXOpen brand only. It is not to be construed as an offer, solicitation, or recommendation with respect to products and services provided by the Companies operating under the FXOpen brand, nor is it to be considered financial advice.
Stay ahead of the market!
Subscribe now to our mailing list and receive the latest market news and insights delivered directly to your inbox.

Latest articles

Pound Weakens After Soft UK Inflation Data as Euro Awaits Fresh Market Signals
The pound remains under pressure following the release of weaker-than-expected UK inflation data. The slowdown in inflation has strengthened expectations that the Bank of England could adopt a more accommodative policy stance in the coming months, weighing on sterling. Meanwhile,

Alphabet: Record Profit as Markets Await Their Verdict
On 22 July, Alphabet reported its Q2 2026 results, with revenue rising 24% year-on-year to $119.8 billion. Google Cloud revenue surged 82% to $24.77 billion, comfortably exceeding analysts' expectations. Search advertising generated $63.3 billion in revenue (+17%

NZD/USD Analysis: A Tug-of-War at the Critical Level
The kiwi has strengthened meaningfully against most peers this month. However, against the US dollar specifically, NZD/USD remains well below its 2026 highs, trading in the mid-0.58 area versus January's peak near 0.6075.
New Zealand's Q2 inflation