


Descending Channel Pattern
FXOpen
In a previous FXOpen guide, we talked about channels and one of their varieties, the ascending channel. In this one, we are covering another variation; the descending channel.
The descending channel pattern is an important charting tool that technical analysts use to evaluate the future price movements of an asset and the overall trend direction. Learning how to recognize and trade this pattern helps traders make more informed trading decisions.
What Is a Descending Channel?
A descending channel is a pattern that forms when an asset is consistently trending lower over time. It is also called a falling or downward channel as it characterizes a falling price moving downwards. The pattern is characterized by two parallel lines that create a channel, with the upper line acting as resistance and the lower line acting as support. The upper line is created by connecting the lower highs, while the lower line is created by connecting the lower lows.

A descending channel can be a bullish or bearish pattern as it only indicates that the asset's price is likely to continue to fall, but this can be an ending point or a continuation of a downtrend. This pattern is seen in various financial markets, including stocks, forex, and commodities.
How to Construct a Downward Channel Pattern
To construct this formation, traders first identify the highs and lows of the asset movement. Once the highs and lows have been identified, the trader draws two parallel lines. The upper line should be drawn through at least two lower peaks, while the lower line should be drawn through at least two lower bottoms.
On our charting platform, TickTrader, you can also find a “parallel channel” tool that is useful in drawing the pattern. Also, you can use a standard trendline tool and draw resistance and support levels that will serve as boundaries for the price movements.
Now let’s look at some live chart examples.

On the 5-minute chart of the EUR/USD pair above, you can see an example of a bearish formation. After the asset experienced its first decline, it consolidated in this descending range and broke out to the downside with stronger momentum.
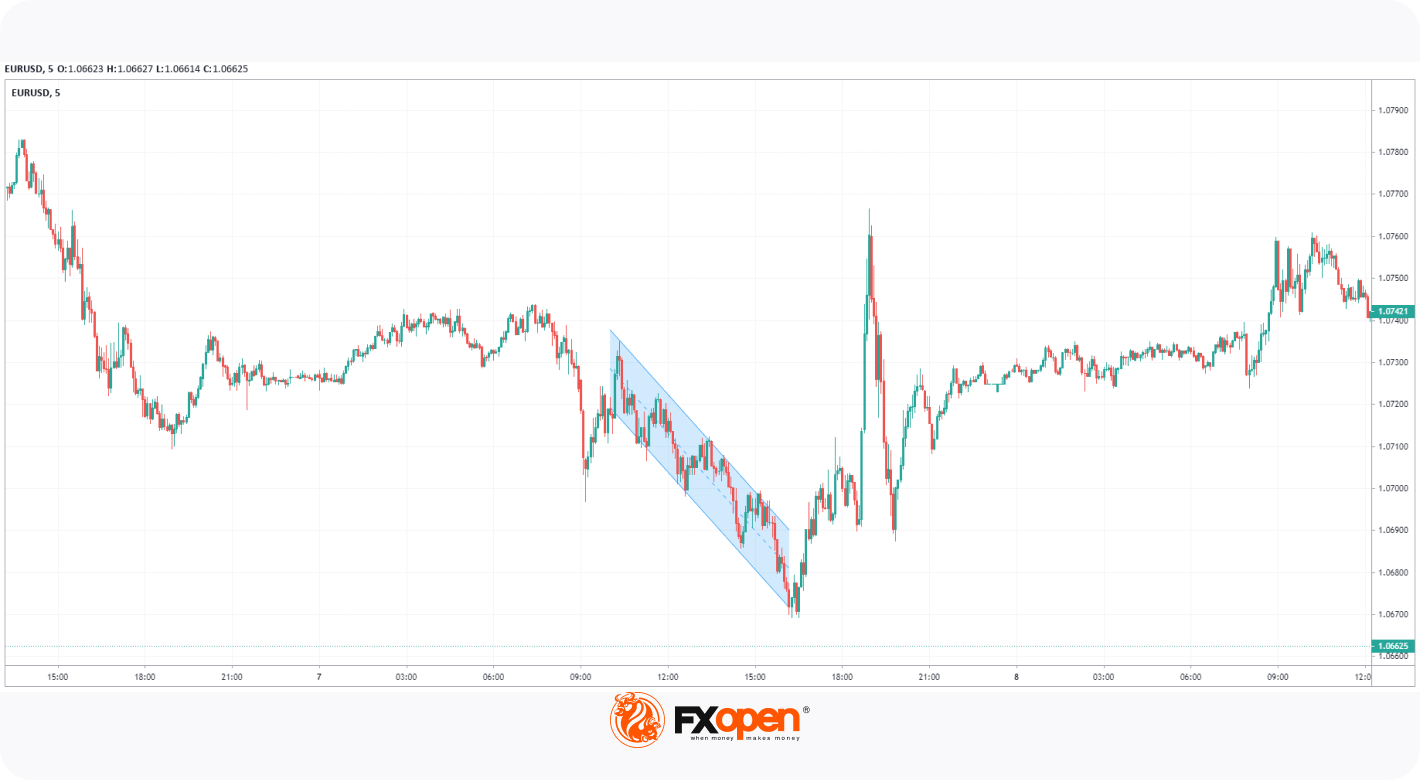
Oftentimes the pattern can be found as an ending formation, after which a breakout to the upside occurs. On the EURUSD 5 min chart, we see that after a strong move down ended, the market turned to the upside. In this case, this was a bullish formation.
How to Trade a Descending Channel
There are two primary strategies traders implement: trading the range and trading the breakout.
Trading the Range
When trading the range, a trader buys the asset when it is at the support level and sells when it is at the resistance level.
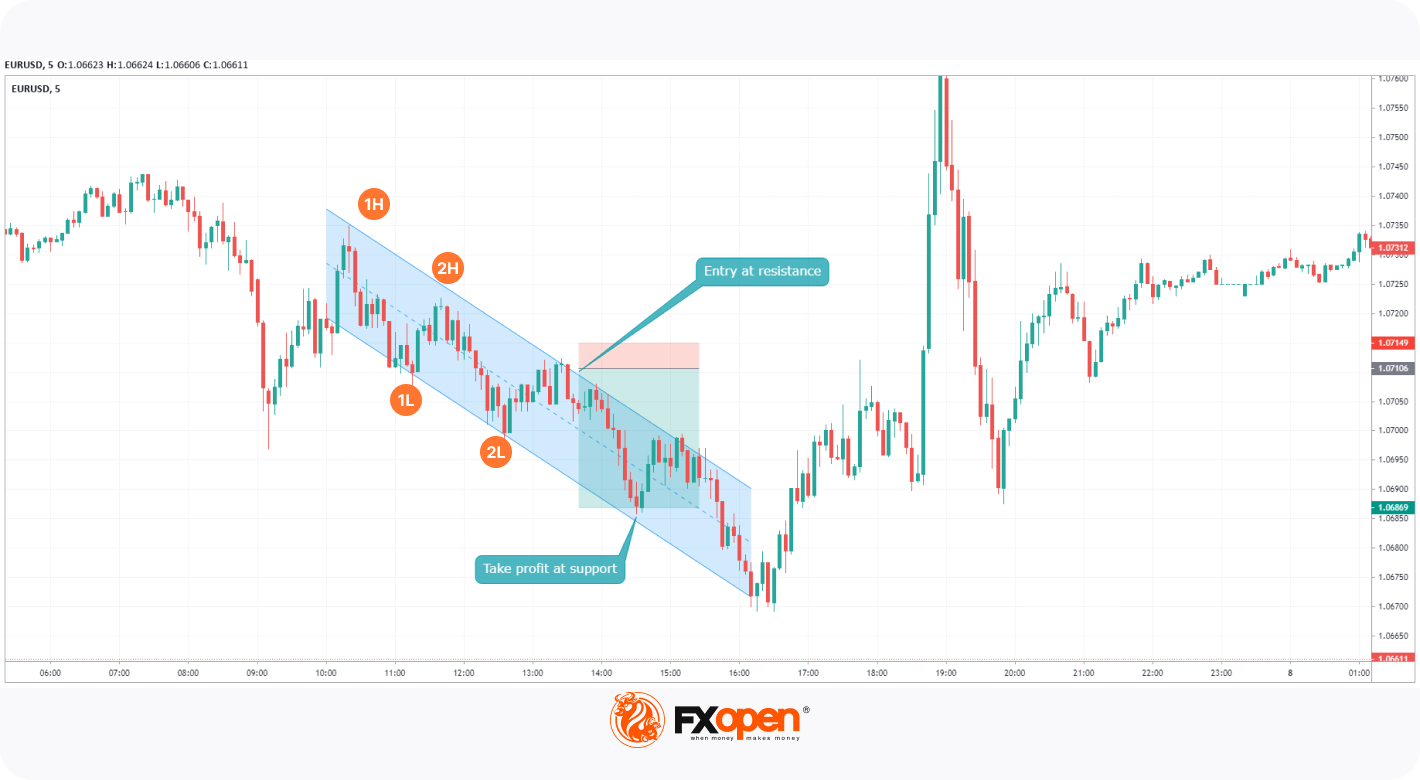
Since the parallel lines first have to form, a trader has to wait for at least two lower peaks and lower bottoms to be formed. A short position can be placed on the third lower high after the price gets rejected. The take-profit target is projected on the support level (lower trendline), and the stop-loss level is usually just above the third lower high. Conversely, a trader can open a buy position on the third lower low after the price rebounds. The take-profit target is projected on the resistance level (upper trendline), and the stop-loss level is usually just below the third lower low.
Some traders use the mean reversion approach. As you can see, there is a middle line between the boundaries – a mean. When opening a trade at support or resistance, traders expect the market to reverse to at least the mean line.
If the range is wide, the mean can be used at the first target and the opposite line as the second target. A stop-loss level can be trailed to reduce the risk/reward ratio.
Trading a Breakout
When trading a descending channel breakout, the trader waits for the price to break beyond its boundaries: either below the support level in a bearish case or above the resistance level in a bullish one.
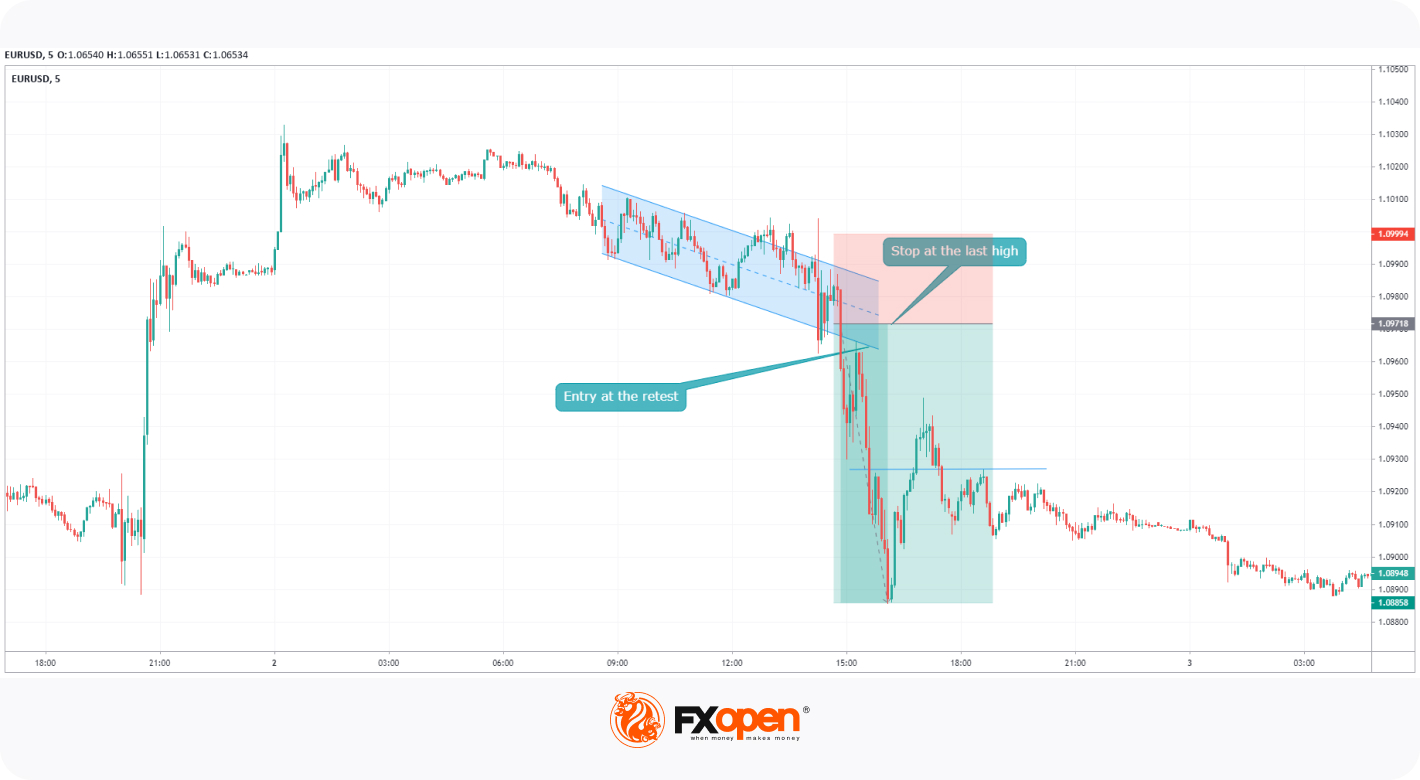
In this bearish example, once the price breaks below the support level, a trader can take a short position and ride the downtrend. Considering that it frequently retests the prior support for resistance, entering on a retest would be the safest way to enter the market.
A stop-loss level can be placed above the high from which the breakout move started. When it comes to the take-profit target, it depends on the momentum behind the move. This is why it may be effective to trail the stop loss to the new lower high in order to maximise your profit potential.
The chart above shows the EURUSD pair moving in a range in which the sellers are applying gradual pressure and buyers are equally lowering theirs. This is why it resulted in a loss of support as the buyers removed their orders, and the asset continued to move downward with strong momentum. A trader could go short after the pair retested the support level that turned into resistance. A stop-loss level could be placed slightly above the retest. A take-profit would depend on the strength of sellers but could be placed at the recent bottoms.
Takeaway
The descending channel is one of the more popular formations that traders use. It’s useful for those who aim to trade in ranges and at the early stages of significant momentum. The pattern is useful in predicting future price movements and identifying trend direction. By learning how to identify and trade this pattern, you may make more informed trading decisions and potentially increase the effectiveness of your trades. You can open an FXOpen account to examine the downward channel pattern.
This article represents the opinion of the Companies operating under the FXOpen brand only. It is not to be construed as an offer, solicitation, or recommendation with respect to products and services provided by the Companies operating under the FXOpen brand, nor is it to be considered financial advice.
Stay ahead of the market!
Subscribe now to our mailing list and receive the latest market news and insights delivered directly to your inbox.


Latest articles

Intel at a Crossroads: Earnings Beat Meets Technical Resistance
Intel has just delivered its strongest quarter in over fifteen years, and the market reaction says it all. Q2 2026 revenue surged 25% year-over-year to $16.1 billion, crushing the consensus estimate of $14.42 billion, while adjusted EPS of

Tesla: Complex Range Structure Breaks Down Following Quarterly Earnings
Tesla released its Q2 2026 results after the market closed on 22 July. Revenue increased 26% year-on-year to $28.24 billion, while vehicle deliveries reached a record 480,126 units. However, operating margin fell sharply to 1.4%, down from

Pound Weakens After Soft UK Inflation Data as Euro Awaits Fresh Market Signals
The pound remains under pressure following the release of weaker-than-expected UK inflation data. The slowdown in inflation has strengthened expectations that the Bank of England could adopt a more accommodative policy stance in the coming months, weighing on sterling. Meanwhile,