


Candlestick Reversal Patterns in Forex Trading
FXOpen
Candlestick reversal patterns are formations that signal a potential shift in price direction as an existing trend begins to lose momentum. They typically appear at the end of trends, where buying or selling pressure starts to weaken, offering traders an early indication of a possible turning point.
There are many ways to spot a trend reversal, including momentum indicators, trend-following tools, and chart and candlestick patterns. Candle patterns, in particular, have been widely used by traders for decades due to their clear structure and well-defined signals, which have been tested and applied across various financial markets.
Depending on the data source, the total number of candlestick patterns ranges from 30 to more than 100, when niche formations are included. Since it may be challenging to remember and recognise all of them, we have selected 10 of the most popular reversal candlestick patterns that traders with any level of experience can implement in their trading strategies.
Definition and Market Function
Candlestick reversal patterns are formations on a price chart that signal a potential trend change after an extended move. Each candle captures the open, high, low, and close for a set period. The shape of the formation reflects the balance between buyers and sellers at that moment.
Reversal differs from retracement. A reversal points to a change in the dominant trend. A retracement is a counter-move within a trend that quickly resumes. Context matters. A pattern carries weight when it forms at a tested support or resistance level and aligns with recent market structure. In the middle of a range, the same shape means little.
This article covers 10 reversal candlestick patterns:
- Hammer
- Inverted Hammer
- Hanging Man
- Shooting Star
- Three Black Crows
- Three White Soldiers
- Bullish Engulfing
- Bearish Engulfing
- Piercing Line
- Dark Cloud Cover
Market Interpretation of Reversals
Market structure shifts when sustained move exhausts and the opposing side quietly builds conviction. The turn often shows in price action before lagging indicators like moving averages or oscillators react.
Three forces cluster around a change in market structure:
- Liquidity pools build near trend extremes, where stop orders sit above swing highs or below swing lows.
- Positioning becomes one-sided, exposing the weaker side to a squeeze.
- Volatility often expands at the turn, producing wide-range candles with long wicks.
Reading the signal requires trend context and level alignment, not shape alone.
Classification of Reversal Patterns
Candlestick reversal patterns in forex fall into three groups by candle count. Single-candle patterns form in one candle. The hammer, hanging man, inverted hammer, and shooting star belong here. Their signal rests on wick-to-body ratio and trend position.
Double-candle patterns involve two consecutive candles. Bullish engulfing, bearish engulfing, piercing line, and dark cloud cover sit in this group. The second candle is opposite and usually overwhelms the first.
Triple-candle patterns need three candles to complete. Three white soldiers and three black crows form this category. They develop slowly but show directional pressure.
Bullish Reversal Patterns
Bullish reversal patterns form at the end of downtrends. Selling momentum fades as buyers regain control.
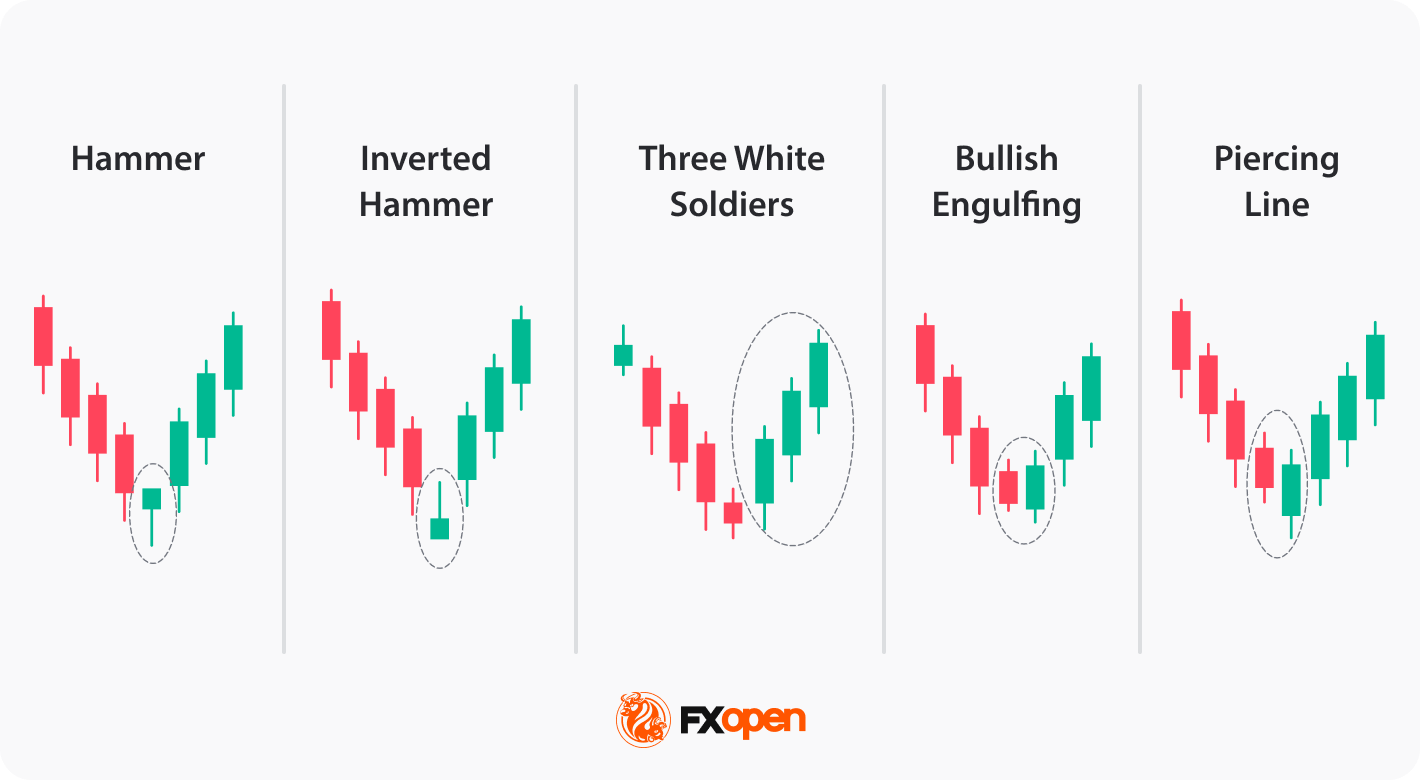
Hammer
The hammer candlestick pattern has a small body, a lower wick at least twice the body length, and little to no upper wick. It appears at the end of a downtrend after sustained selling pressure. A close above the hammer's high on the following candle supports the signal.
Inverted Hammer
The inverted hammer has a small body, an upper wick at least twice the body length, and little to no lower wick. It forms after a prolonged downtrend, often near a tested support zone. Traders often look for the next session to close above the candle's body before acting.
Three White Soldiers
The three white soldiers pattern consists of three consecutive bullish candles, each opening within the prior body and closing at a new high with short upper wicks. It develops after a downtrend, typically following a stall near the low. The third candle closing above a recent resistance level adds weight to the pattern.
Bullish Engulfing
The bullish engulfing forms when a bullish candle's body fully covers the prior bearish candle's body. It appears at the end of a downtrend, with the bearish candle often marking the final push lower. Confirmation is found when a close is seen above the engulfing pattern, meaning the reversal likely has more weight.
Piercing Line
The piercing line pairs a long bearish candle with a bullish candle that opens below the prior low and closes above the bearish body's midpoint. It forms at the end of a downtrend, often at a tested support zone. Another bullish candle forming after the pattern reinforces the signal.
Bearish Reversal Patterns
These bearish reversal patterns form at the end of uptrends. Buying momentum fades as sellers regain control.
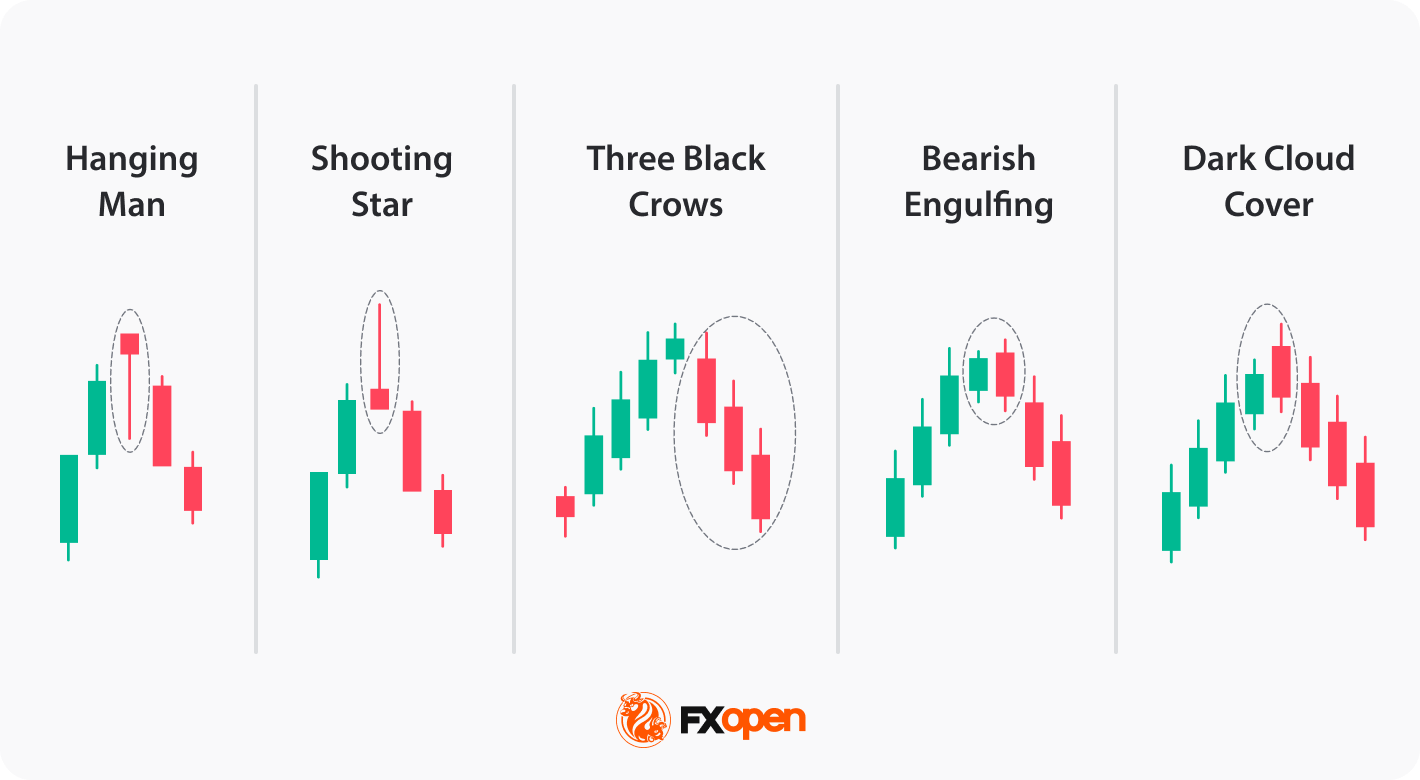
Hanging Man
The hanging man has a small body, a lower wick at least twice the body length, and little to no upper wick. This candlestick pattern structure appears at the end of an uptrend after sustained buying pressure. A close below the hanging man's low on the following candle supports the signal.
Shooting Star
The shooting star has a small body, an upper wick at least twice the body length, and little to no lower wick. It forms after a prolonged uptrend, often near a tested resistance zone. Traders often look for the next candle to close below the candle's body before acting.
Three Black Crows
The three black crows formation consists of three consecutive bearish candles, each opening within the prior body and closing at a new low with short lower wicks. It develops after an uptrend, typically following a stall near the high. The third candle closing below a recent support level adds weight to the pattern.
Bearish Engulfing
The bearish engulfing forms when a bearish candle's body fully covers the prior bullish candle's body. It appears at the end of an uptrend, with the bullish candle often marking the final push higher. A close below the engulfing candle's low session supports the reversal.
Dark Cloud Cover
The dark cloud cover setup pairs a long bullish candle with a bearish candle that opens above the prior high and closes below the bullish body's midpoint. It forms at the end of an uptrend, often at a tested resistance zone. Another bearish candle forming after the pattern reinforces the signal.
How Traders Identify Reversal Candles
Identifying a candlestick reversal pattern involves four observable checks. Each one either confirms or filters the signal before it carries weight.
- Trend presence: the pattern forms at the end of a clear uptrend or downtrend. Shapes that appear inside a range or consolidation carry little meaning.
- Key level alignment: the pattern aligns with a tested support or resistance zone, a prior swing point, or a known supply or demand area.
- Candle structure: wick-to-body ratios, close position, and body size match the pattern's definition. Loose approximations dilute the signal.
- Confirmation: the next candle closes in the reversal direction, or a second pattern, indicator reading, or price-action event aligns with the signal before action.
Skipping any of the four reduces the pattern to a shape on the chart rather than a usable signal. Platforms such as TickTrader let traders explore, identify, and trade these patterns across multiple instruments.
Application in Trading Context
Candlestick reversal patterns sit inside a wider decision process rather than drive trades on their own. Position sizing, stop placement, and volatility conditions shape how traders interpret and act on any signal.
Risk context matters at the trade level. A pattern at a major resistance zone in a quiet market carries different weight than the same pattern ahead of an important economic release. Traders often scale position size based on volatility, recent range, or proximity to liquidity levels. Broader risk management frameworks often define stop placement based on the pattern's structure rather than arbitrary price offsets.
Volatility expansion around reversal patterns cuts both ways. Wider price ranges can make candlestick patterns more visually distinct, but they also increase the likelihood of false breakouts and unreliable signals. False signals appear more often around news releases, low-liquidity hours, and transitions between major trading windows.
Limitations and Market Risks
Candlestick reversal patterns in technical analysis have consistent limitations worth naming directly.
- Low-liquidity conditions distort pattern formation. Thin order books produce wider spreads, longer wicks, and candles that look like patterns but lack the participation to drive a reversal. Exotic currency pairs during off-peak hours often show this behaviour.
- News releases override technical structure. A hammer printed seconds before a non-farm payrolls release may face volatility that ignores the pattern entirely. Scheduled events and surprise headlines both reset short-term price structure.
- Timeframe dependency shapes signal weight. The same pattern on a 1-hour chart often carries less weight than on a daily or weekly chart, where each candle represents more participation and more information.
Takeaway
Bullish vs bearish candlestick patterns are tools for identifying shifts in market direction across forex, stocks, indices, and commodities. They carry weight when structure, trend context, and key levels align.
In practice, traders treat them as early signals and rely on confirmation before acting. Combined with sound risk management, they may help refine timing.
Traders who want to test candlestick patterns and develop their own strategies can consider opening an FXOpen account today and access over 700 instruments with tight spreads and low commissions (additional fees may apply). Good luck!
FAQ
What Are Candlestick Reversal Patterns?
Candlestick reversal patterns are single candles or short sequences that form at the end of a trend and mark a potential change in market direction. They reflect a shift in the balance between buyers and sellers, visible through the candle's open, close, high, and low. Common examples include the hammer, shooting star, engulfing patterns, and three black crows. Their weight depends on where they form, not just their shape.
Which Candlestick Patterns Signal a Reversal?
Ten patterns commonly appear in reversal analysis: hammer, hanging man, inverted hammer, shooting star, three white soldiers, three black crows, bullish engulfing, bearish engulfing, piercing line, and dark cloud cover. Each pattern carries weight only when it appears at a tested level in a clear trend.
What Is the Difference Between Bullish and Bearish Reversal Patterns?
Bullish reversal patterns form at the end of a downtrend and point to a potential move higher. Hammer, inverted hammer, bullish engulfing, three white soldiers, and piercing line sit in this group. Bearish reversal patterns form at the end of an uptrend and point to a potential move lower. Hanging man, shooting star, bearish engulfing, three black crows, and dark cloud cover belong here. Shapes often mirror across the pair.
Do Candlestick Reversal Patterns Require Confirmation?
Confirmation matters when trading candlestick patterns. A pattern on its own shows a shift in the last candle or two, but not whether the broader trend has turned. Traders often wait for the next candle to close in the reversal direction, or for a second signal from price action, a technical indicator, or a break of a key level. Patterns that form without confirmation produce more false signals, especially in low-liquidity or high-news conditions.
Are Reversal Patterns Popular in Forex Trading?
In forex, reversal signals are widely used, and for reasons tied to the market's structure. Forex runs 24 hours on weekdays across overlapping sessions, producing clear trending and reversal behaviour around liquidity transitions. The patterns work across major, minor, and exotic pairs, and across all timeframes from intraday to weekly. Traders often combine them with support and resistance zones, moving averages, or momentum readings to filter signals.
This article represents the opinion of the Companies operating under the FXOpen brand only. It is not to be construed as an offer, solicitation, or recommendation with respect to products and services provided by the Companies operating under the FXOpen brand, nor is it to be considered financial advice.
Stay ahead of the market!
Subscribe now to our mailing list and receive the latest market news and insights delivered directly to your inbox.


Latest articles

US Dollar Index: A Defining Week for the King of the Markets
The dollar heads into a pivotal week trading near 101.80, just off a 15-month high, with the Fed's July 29 meeting standing as the clear focal point. Markets currently price roughly a 65% chance of a hold, though renewed

NZD/USD: Inflation Surge Meets Strong US Dollar Pressure
On 21 July, Stats NZ reported an acceleration in inflation: the Consumer Price Index rose 1.5% in the second quarter, while the annual inflation rate climbed to 4.1%, its highest level in more than two years and slightly

Weekly Market Insights with Gary Thomson: The Week of Central Banks and Earnings
In this video, we’ll explore the key economic events and market trends, shaping the financial landscape. Get ready for insights into financial markets to help you navigate the week ahead. Let’s dive in!
In this episode of Market