


Ether Bounces at Support, Dash Down Again
FXOpen
Another two weeks of red for both Ethereum and Dash. Ether is down by close to 15 percent while Dash is heading back down. Let’s start with ETH/BTC and we’ll get back to Dash later in the article.
Ether Down Almost 15 Percent
Another two grueling weeks for ETH bulls as prices continue to head lower. We are currently quoted at 0.01152, 14.6 percent below the price noted during our previous update.
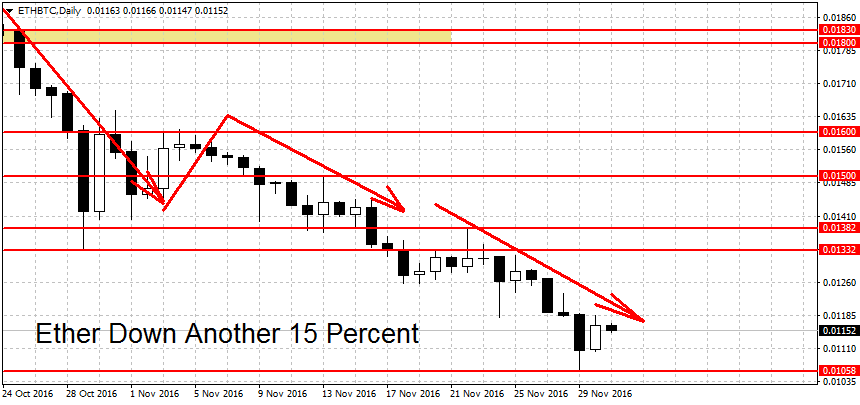
The downtrend is still firmly in place in this pair. To end it, the bulls will have to stage a breakout above the 0.01382 swing high. Slightly below here we find another strong resistance at 0.01332. This is the October low in ETH/BTC which acted as support during November. Support becomes resistance and this level will likely put pressure on rising prices. The threshold to starting a new Ether rally is set even higher at the 0.015 round figure. You can see more of the levels to the upside on our chart.
On the lower end we have support at the November lows of 0.01058, closely followed by the round 0.01 figure. A decisive break below here could intensify the losses. Ethereum is a relatively new coin, so there’s not much in the form of previous support levels below here. The semi-round figure at 0.05 may also act as support but other then that, it’s enough’s guess where prices may stall or bottom out.
Dash Heading Down Again
After a short respite, Dash is heading lower again. We’re trading at 0.01190 right now, 5.8 percent lower compared to two weeks ago. As we can see on the chart below, prices tested October’s low at 0.01116 but were quickly repelled after a brief excursion to 0.01110.
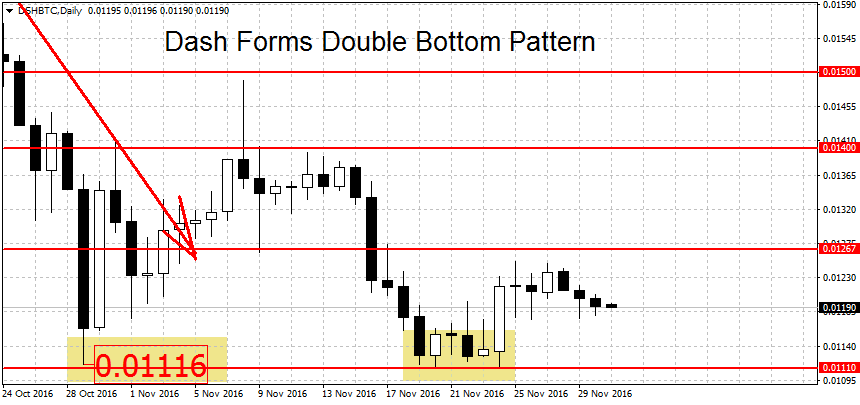
With this move DSH/BTC has now formed a double bottom pattern. Further confirmation is needed however. A decisive break below the 0.0111 lows would invalidate the pattern and start a new downtrend. Below here we have more support at the 0.01 round figure.
On the other end, a breakout above 0.014 is needed to start a new uptrend. Resistance above here can be found at the 0.01489 swing high, followed by the round figure at 0.015. We have more resistance above here at the September lows of 0.01741 per BTC, closely followed by the 0.01822 swing low and the 0.02 round figure.
FXOpen offers the world's most popular cryptocurrency CFDs*, including Bitcoin and Ethereum. Floating spreads, 1:2 leverage — at your service (additional fees may apply). Open your trading account now or learn more about crypto CFD trading with FXOpen.
*Important: At FXOpen UK, Cryptocurrency trading via CFDs is only available to our Professional clients. They are not available for trading by Retail clients. To find out more information about how this may affect you, please get in touch with our team.
This article represents the opinion of the Companies operating under the FXOpen brand only. It is not to be construed as an offer, solicitation, or recommendation with respect to products and services provided by the Companies operating under the FXOpen brand, nor is it to be considered financial advice.
Stay ahead of the market!
Subscribe now to our mailing list and receive the latest market news and insights delivered directly to your inbox.


Latest articles

EUR/USD Eyes Gains As USD/CHF Weakness Deepens Again
EUR/USD started a fresh increase above 1.1700 and 1.1720. USD/CHF declined further and is now struggling below 0.7835.
Important Takeaways for EUR/USD and USD/CHF Analysis Today
· The Euro started a decent increase from

Apple: Earnings Day Above the Activity Zone
On 30 April, after the market close, Apple Inc. will release its financial results for the second quarter of fiscal 2026. The consensus forecast, based on estimates from 31 analysts, points to revenue of around $109.7 billion, with expected

USD/JPY and USD/CHF Near Key Levels: The Dollar Supported by the Fed
The US dollar continues to trend upwards following the Federal Reserve meeting, drawing support from the regulator’s moderately hawkish stance and comments by Jerome Powell. Markets interpret the Fed’s rhetoric as a signal that restrictive policy is likely