


ETHUSD and LTCUSD Technical Analysis – 09th DEC, 2021
FXOpen

ETHUSD: Ascending Channel Pattern Above $4,000
Ethereum continues its consolidation phase remaining above the $,4300 handle in the European trading session today.
ETHUSD is slowly preparing itself for its next move against the US dollar. The price continues to recover from its decline below the $4,000 level.
We can clearly see an ascending channel pattern above $4,000 which signifies that the price will continue to rise aiming upwards of $4,500 to $4,700.
ETH is now trading just above its pivot level of $4,374 and moving in a bullish ascending channel. The price of ETHUSD is about to break its classic resistance level of $4,418, its Fibonacci resistance level $4,403, and is now aiming towards the $4,500 handle in the US trading session.
All the major technical indicators are giving a NEUTRAL signal.
ETH is now trading above its 100 hourly and 200 hourly simple moving averages.
- Ethereum continues a bullish channel
- Short-term range appears to be bullish ETHUSD
- All the moving averages are giving a STRONG BUY signal
- Average true range is indicating LESSER market volatility
Ether: Bullish Trend Towards $4,700 Confirmed

In today’s early Asian trading session today, ETHUSD continues to move in a consolidation channel after touching an intraday high of $4,479 and an intraday low of $4,345 in the European trading session.
Today’s relative strength index is NEUTRAL which signifies a potential bullish trend.
It is best to enter into long positions in Ethereum at the present market level of $4,380 with a target of $5,000 for the next month.
The average true range is indicating a lower market volatility as we can see a drop of 11.76 in the trading volume as compared to yesterday. This is because the market was in a consolidation phase and the buyers were waiting for a bullish pattern, which is clearly visible now.
ETH has gained +0.55% with a price change of +23.84$ in the past 24hrs, and has a trading volume of 18.912 billion USD.
Bitcoin vs Ethereum Gains in 2021
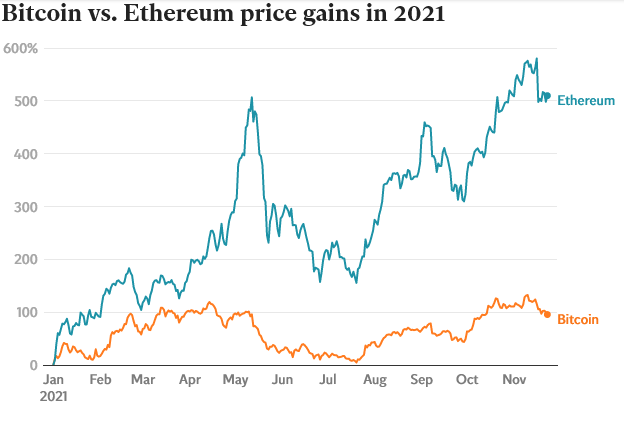
The gains observed in Ethereum have been outstanding as compared to bitcoin during the same period of time. This is because Ether’s underlying technology is far superior to bitcoin’s, which only serves as a mode of payment transfer and Investments.
The demand for Ethereum is currently stronger due to its leading role in the emerging industry of decentralized finance (DeFi), as well as non-fungible tokens (NFTs).
The Week Ahead
Ether is printing above $4,300 today, and this week, we could see a levels of $4,500.
The medium to long-term outlook for Ether remains bullish with targets of above $5,000 the next month.
We have observed an $10 billion increase in Ethereum’s market cap which currently stands at $520 billion.
We have detected an MA50 crossover pattern which signifies a bullish trend in the coming days. A mullish crossover pattern is also seen in the MA20.
Technical Indicators:
Ultimate oscillator: at 49.448 indicating a NEUTRAL market
Moving averages convergence divergence (14-day): at 6.88 indicating a BUY
MA200 (exponential): at 4298.74 indicating a BUY
Rate of price change: at 0.403 indicating a BUY
LTCUSD: Consolidation Channel Above $150
Litecoin continues to move in a consolidation channel above the $150 handle in today’s European trading session.
We saw Litecoin breaking below $130 in a flash crash, but the prices have recovered since then.
Today, LTCUSD touched an intraday high of $167.04 and an intraday low of $158.60 in the Asian trading session.
The markets are giving a mixed signal so it would be better to wait till we can see the trends more clearly.
In current market conditions, we are seeing a shift towards bearish trend formations below the $160 handle.
Litecoin is now trading just above its 100 hourly simple moving average and just below its 200 hourly simple moving average. The price of LTCUSD is about to break its pivot level of 161.06
RSI is indicating a NEUTRAL level which signifies that the markets were ranging in a consolidation phase.
The short-term outlook for Litecoin has turned Bearish.
- All the major technical indicators are giving a STRONG SELL signal
- All the moving averages are giving a SELL signal
- The ultimate oscillator is giving a NEUTRAL market signal
- Average true range is indicating LESSER market volatility
Litecoin Continues Consolidation Channel Above $150

The price of Litecoin is still in a consolidation phase today and is moving in a narrow range between $150 and $170.
A short-term bearish phase for Litecoin is clearly visible, and we are aiming for a break below $160 today.
The price of LTCUSD is now facing its classic support level of $159.43 and Fibonacci support level of $156.86 after which the path towards $150 will get cleared.
Litecoin’s trading volume has increased by 3.86% as compared to yesterday due to more buyers entering the markets.
In the last 24hrs, LTCUSD has gone DOWN by 4.67% with a price change of 7.84$, and has a 24hr trading volume of 1.930 billion USD.
The Week Ahead
Litecoin needs to remain above its major support level of $158 for any bullish reversal. The selling pressure in Litecoin is increasing which is why its prices can slide below the $160 handle at any given time.
The relative strength index is neutral which signifies that markets are still in a consolidation phase.
We will have to wait before entering the markets at present conditions, and a break below $150 will mark a potential entry point for a bullish reversal.
Technical Indicators:
MA200 (simple): at 175.44 with a SELL
STOCH (9,6): at 29.07 with a SELL
Moving averages convergence divergence (12,26): at -0.464 indicating a SELL
Average directional index (14-day): at 24.81 indicating a SELL
FXOpen offers the world's most popular cryptocurrency CFDs*, including Bitcoin and Ethereum. Floating spreads, 1:2 leverage — at your service (additional fees may apply). Open your trading account now or learn more about crypto CFD trading with FXOpen.
*Important: At FXOpen UK, Cryptocurrency trading via CFDs is only available to our Professional clients. They are not available for trading by Retail clients. To find out more information about how this may affect you, please get in touch with our team.
This article represents the opinion of the Companies operating under the FXOpen brand only. It is not to be construed as an offer, solicitation, or recommendation with respect to products and services provided by the Companies operating under the FXOpen brand, nor is it to be considered financial advice.
Stay ahead of the market!
Subscribe now to our mailing list and receive the latest market news and insights delivered directly to your inbox.


Latest articles
DAX 40: Can the Index Print Fresh Record Highs Once Again?
The DAX 40 has shed more than 2% over the past several sessions, breaking a rally that had pushed the index to record highs on the back of Germany's fiscal pivot toward defence, infrastructure and climate spending. The pullback raises

US Dollar Consolidates Ahead of FOMC Minutes Release
The US dollar has entered a period of consolidation following last week's sharp price swings, as market participants turn their attention to the release of the Federal Reserve's latest meeting minutes. Investors are looking for additional guidance on the future

EUR/USD Analysis: Who Is in Control?
Two central banks, two hawkish tones — but only one dollar just took a hit. The ECB delivered a 25bp hike in June, its first since 2023, lifting the deposit rate to 2.25% as Middle East-driven energy costs pushed headline