


ETHUSD and LTCUSD Technical Analysis – 16th DEC, 2021
FXOpen

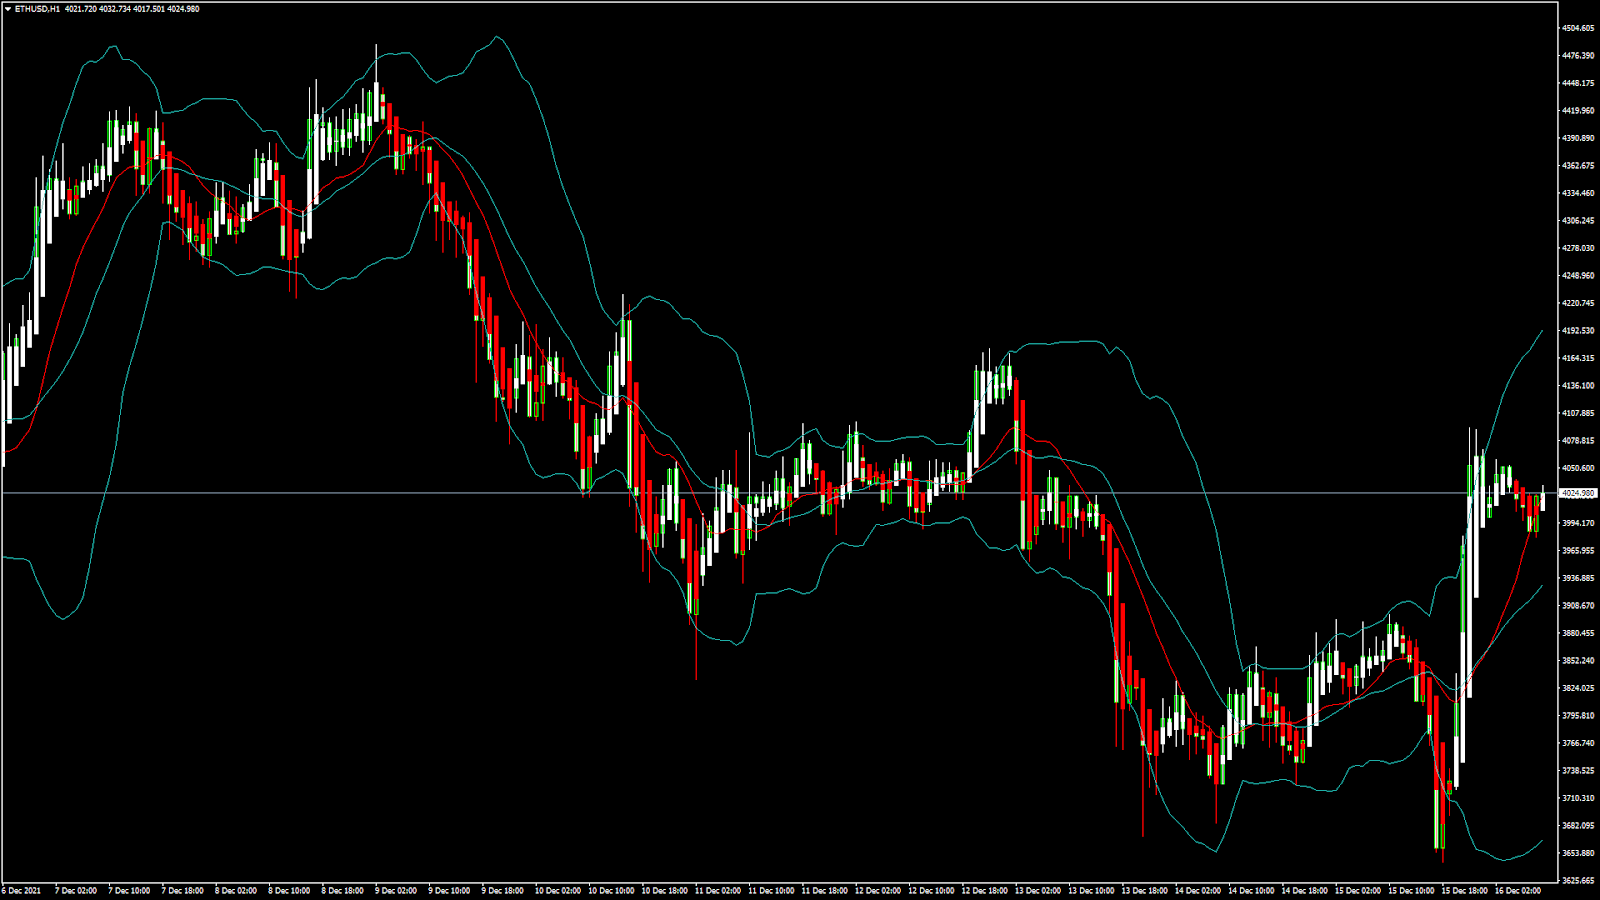
ETHUSD: Double Bottom Pattern Above $3,600
Ethereum started this week on a mild bullish tone by touching a high of $4,169 after which the decline started pushing its prices below the $4,000 handle.
We saw Ethereum touching an intraday low of $3,654 yesterday, after which fresh buying in the market pushed its prices all the way above the $4000 mark. The recovery was also backed by the Three Arrows Capital hedge fund purchasing $56 million worth of Ether.
ETHUSD is slowly preparing itself for its next move against the US dollar.
We can clearly see a double bottom pattern above $3,600, which signifies the end of a downtrend and a shift towards an uptrend.
ETH is now trading just above its pivot level of $3,998 and moving in a bullish ascending channel. The price of ETHUSD is about to break its classic resistance level of $4,048, its Fibonacci resistance level of $4,035, and is now aiming towards the $4,200 handle in the US trading session.
All the major technical indicators are giving a STRONG BUY signal.
ETH is now trading above its 100 hourly and below its 200 hourly simple moving averages.
- Ethereum trend reversal seen above $3,600
- Short-term range appears to be bullish for ETHUSD
- All the moving averages are giving a BUY signal
- Average true range is indicating LESS market volatility
Ether: Bullish Reversal towards $4,200 Confirmed
ETHUSD has recovered from its losses and is now moving in the consolidation phase below the $4,200 handle in the European trading session.
Stoch and average directional change are indicating a NEUTRAL market.
We can see a 34.50% increase in the trading volume as compared to yesterday, because the market was in a consolidation phase, and today, new buyers have entered as the bullish pattern is clearly visible.
ETH has gained +4.58% with a price change of +176.90$ in the past 24hrs and has a trading volume of 26.810 billion USD.
The Week Ahead
Ether is now waiting for its next move against the US dollar. We can see that the price continues to hold above the important psychological support level of $4,000.
The medium to long-term outlook for Ether remains bullish with targets of $4,500 to $5,000 in January 2022.
This is also a time when long-term investors tend to liquidate their holdings and withdraw the profits. Because of the coming end-of-year Christmas and New Year holidays, the liquidity will remain low and the advances limited.
We have detected an MA5 crossover pattern which signifies a bullish trend in the coming days. A bullish crossover pattern is also seen in the MA100.
Technical Indicators:
Ultimate oscillator: at 54.75 indicating a BUY
Moving averages convergence divergence (14-day): at 54.07 indicating a BUY
Commodity channel index (14days): at 34.51 indicating a NEUTRAL market
Rate of price change: at 8.161 indicating a BUY
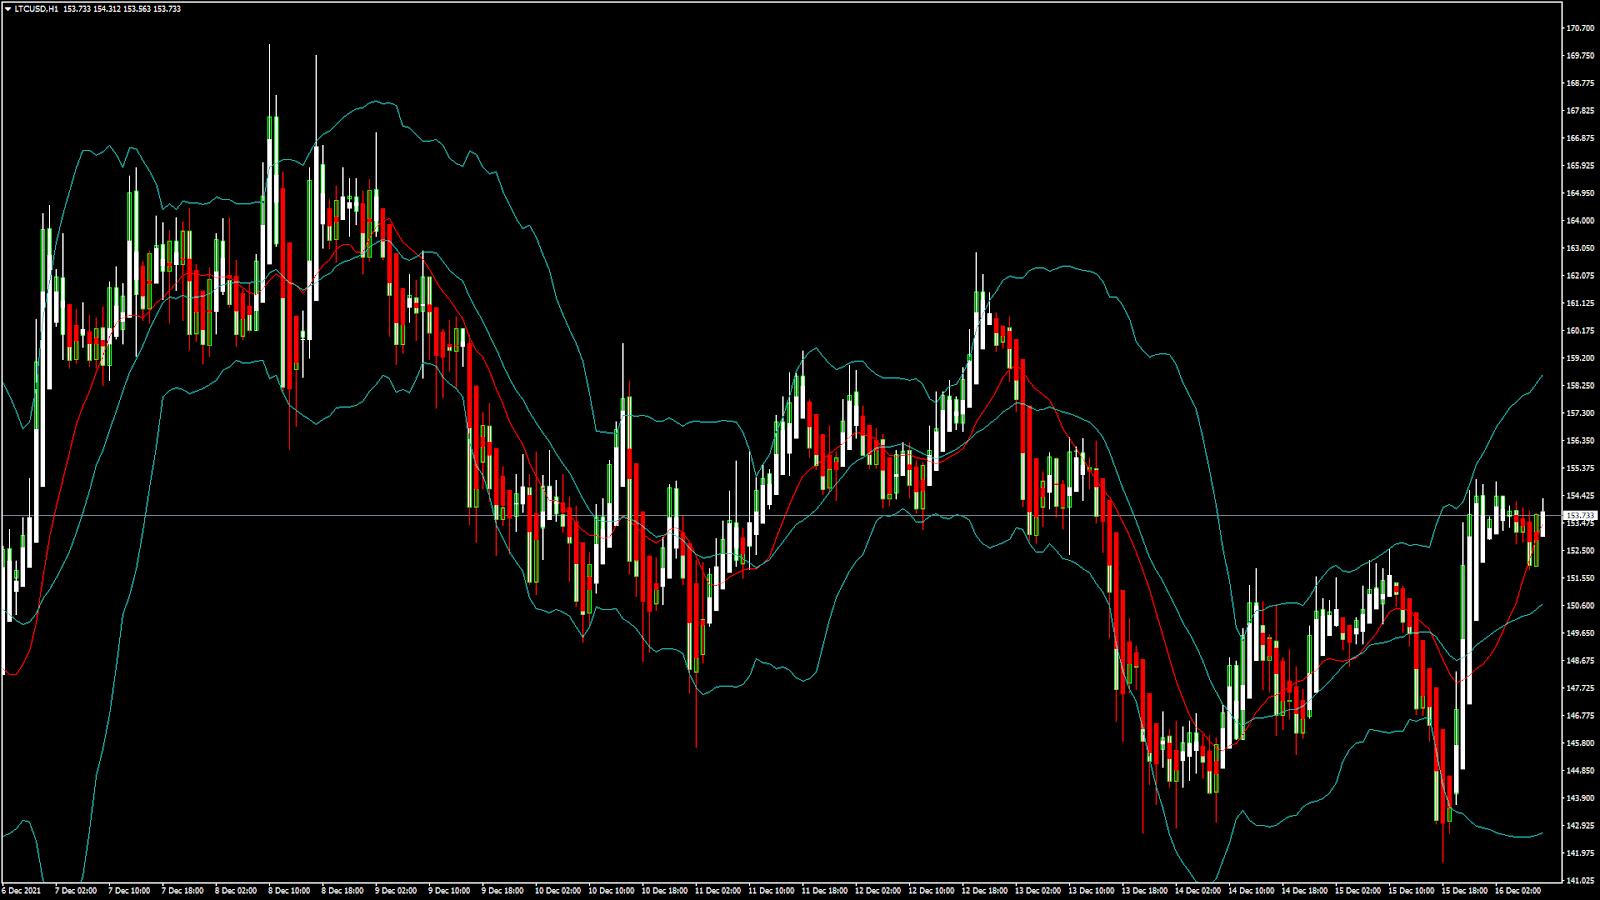
LTCUSD: Double Bottom Pattern Above $140
Litecoin started this week on a mild bullish tone, touching a high of 162.86 after which the bullish momentum failed, and the prices of LTCUSD dropped below the $150 handle.
LTCUSD touched an intraday low of 141.66 after which fresh buying started pushing its prices above the $150 mark.
We can clearly see a double bottom pattern above the $140 handle which signifies the end of a downtrend and a shift towards an uptrend.
Litecoin is now trading just above its 100 hourly simple moving average and just below its 200 hourly simple moving average. The price of LTCUSD has already broken its pivot level of 153.16.
The average directional change is indicating a NEUTRAL level which signifies that the markets were ranging in a consolidation phase.
The short-term outlook for Litecoin has turned bullish.
- All the major technical indicators are giving a STRONG BUY signal
- All the MOVING AVERAGES are giving a STRONG BUY signal
- Williams percent range is indicating an OVERBOUGHT level
- Average true range is indicating LESS market volatility
Litecoin: Bullish Momentum towards $165 Confirmed
Litecoin has recovered from its losses and is now trading above the important support levels of $150 in the European trading session.
With more buying expected, we will see LTCUSD touching or crossing the levels of $155 to $165 in the coming days.
The price of LTCUSD is now facing its classic resistance of 154.43 and Fibonacci support level of 155.06, after which the path towards $160 will get cleared.
Litecoin trading volume has increased by 17.20% as compared to yesterday due to more buyers entering the markets.
In the last 24hrs, LTCUSD has gone UP 1.47% with a price change of 2.22$, and has a 24hr trading volume of 1.333 billion USD.
The Week Ahead
We can see that Litecoin is now in the continuation of its consolidation phase above the $150 handle.
This signifies the support and demand due to the end-of-the-year holiday season, when many of the investors who are liquidating their profits from bitcoin will shift towards Litecoin as a store of value.
The average directional change in indicating a neutral level, which signifies that markets are still in a consolidation phase.
This is the perfect timing for a long entry into the markets for those investors who are looking for a 6-months time frame to reap their profits.
Technical Indicators:
Relative strength index (14-day): at 59.33 indicating a BUY
Commodity channel index (14-day): at 72.11 indicating a BUY
Moving averages convergence divergence (12, 26): at 1.279 indicating a BUY
Ultimate oscillator: at 54.23 indicating a BUY
FXOpen offers the world's most popular cryptocurrency CFDs*, including Bitcoin and Ethereum. Floating spreads, 1:2 leverage — at your service (additional fees may apply). Open your trading account now or learn more about crypto CFD trading with FXOpen.
*Important: At FXOpen UK, Cryptocurrency trading via CFDs is only available to our Professional clients. They are not available for trading by Retail clients. To find out more information about how this may affect you, please get in touch with our team.
This article represents the opinion of the Companies operating under the FXOpen brand only. It is not to be construed as an offer, solicitation, or recommendation with respect to products and services provided by the Companies operating under the FXOpen brand, nor is it to be considered financial advice.
Stay ahead of the market!
Subscribe now to our mailing list and receive the latest market news and insights delivered directly to your inbox.


Latest articles

US Dollar Strengthens Amid Equity Market Weakness and Hawkish Fed Rhetoric
The US dollar continues to hold firm near multi-year highs as sentiment across equity markets deteriorates and investors increasingly expect the Federal Reserve to maintain a restrictive monetary policy stance for longer. The US economy remains resilient, while inflation risks

Bitcoin: Corrective Channel Broken as Traders Turn More Active
Bitcoin has come under the influence of several factors simultaneously. The wave of selling at the beginning of June was linked to Strategy's first disclosed Bitcoin sale in several years, a prolonged series of outflows from spot ETFs, and a

DAX 40: consolidation amid technology sell-off
A wave of selling in the technology sector that emerged earlier this week has weighed on European equities. The trigger was investor concern over the profitability of large-scale debt-funded investments by major US tech companies in AI infrastructure. The Nasdaq