


ETHUSD and LTCUSD Technical Analysis – 30th JUNE, 2022
FXOpen

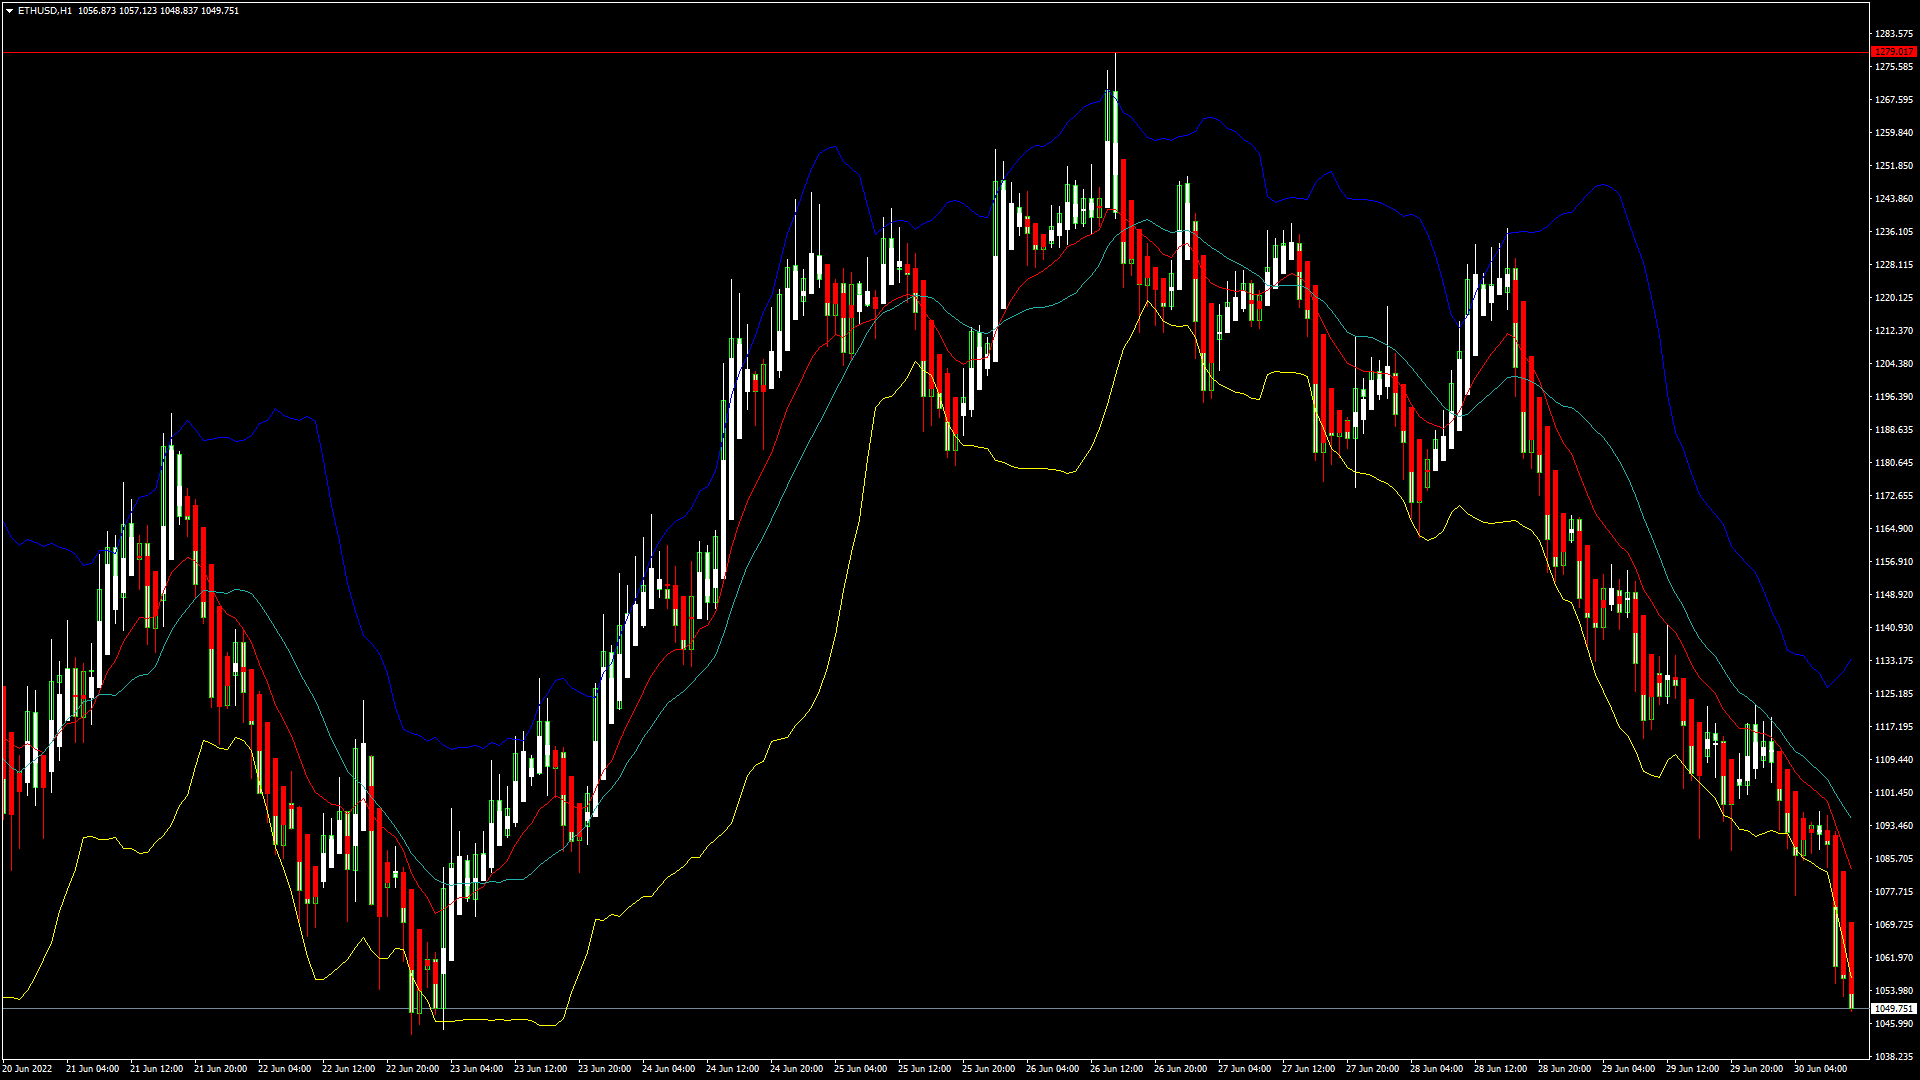
ETHUSD – Bearish Doji Star Pattern Below $1279
Ethereum was unable to sustain its bullish momentum and after touching a high of 1278 on 26th June started to decline heavily against the US Dollar.
We can see that the prices have fallen below the $1100 handle and now trading at $1052 in the European Trading session today.
We can see the formation of a Falling Trend Channel below the $1200 handle and now we are looking at $1050 and $1000 as the immediate targets.
The prices touched an Intraday Low of $1049 in the European Trading session and an Intraday High of $1117 in the Asian Trading session today.
We can clearly see a Bearish Doji Star Pattern Below the $1279 handle which is a Bearish pattern and signifies the end of a Bullish phase and the start of a Bearish phase in the markets.
ETH is now trading below its Pivot levels of 1069 and is moving into a Strong Bearish channel. The price of ETHUSD is now testing its Classic support levels of 1015 and Fibonacci support levels of 1057 after which the path towards 1000 will get cleared.
Relative Strength Index is at 24 indicating an OVERSOLD market and the shift towards the consolidation phase in the markets.
Both the STOCHRSI and Williams Percent Range are indicating Oversold levels, which means that the prices are due to correct upwards in the short-term range.
All of the of the Technical indicators are giving a STRONG SELL market Signal.
All of the Moving Averages are giving a STRONG SELL Signal and we are now looking at the levels of $1000 to $950 in the short-term range.
ETH is now trading Below its both the 100 Hourly Simple and Exponential Moving Averages.
- Ether Bearish Reversal seen Below the $1279 mark.
- Short-term range appears to be Strongly BEARISH.
- ETH failed to clear its resistance of $1300.
- Average True Range is indicating LESS Market Volatility.
Ether Bearish Reversal Seen Below $1279
ETHUSD is now moving into a Strong Bearish Channel with the prices trading below the $1100 handle in the European Trading session today.
We have also detected the formation of a Bearish Harami pattern in the 15-minutes timeframe indicating weakness and the continuation of the downtrend.
The Commodity Channel Index is giving Oversold levels which means that the prices of Ethereum are due for an upwards correction.
The key support levels to watch are $1036 and $1015 and the prices of ETHUSD need to remain above these levels for any Bullish reversal.
ETH has decreased by 7.05% with a price change of 79$ in the past 24hrs and has a trading volume of 15.621 Billion USD.
We can see an Increase of 7.43% in the total trading volume in last 24 hrs. which appears to be Normal.
The Week Ahead
The global investor sentiments are weak due to the changing Geo-political situation in the Europe, amid the ongoing Russia-Ukraine conflict and meeting of NATO leaders in Madrid.
The prices of Ethereum continue to remain above the important psychological support levels of $1000 and most of the technical are now indicating a Neutral market.
The immediate short-term outlook for the Ether has turned as Strongly BEARISH, the medium-term outlook has turned NEUTRAL, and the long-term outlook for Ether is NEUTRAL in present market conditions.
In this week Ether is expected to move in a range between the $1000 and $1150 and in the next week Ether is expected to enter into a Consolidation phase above the $1100 levels.
Technical Indicators:
STOCH (9,6): It is at 38.51 indicating a SELL.
Average Directional Change(14days): It is at 40.18 indicating a SELL.
Rate of Price Change: It is at -4.50 indicating a SELL.
Ultimate Oscillator: It is at 34.22 indicating a SELL.
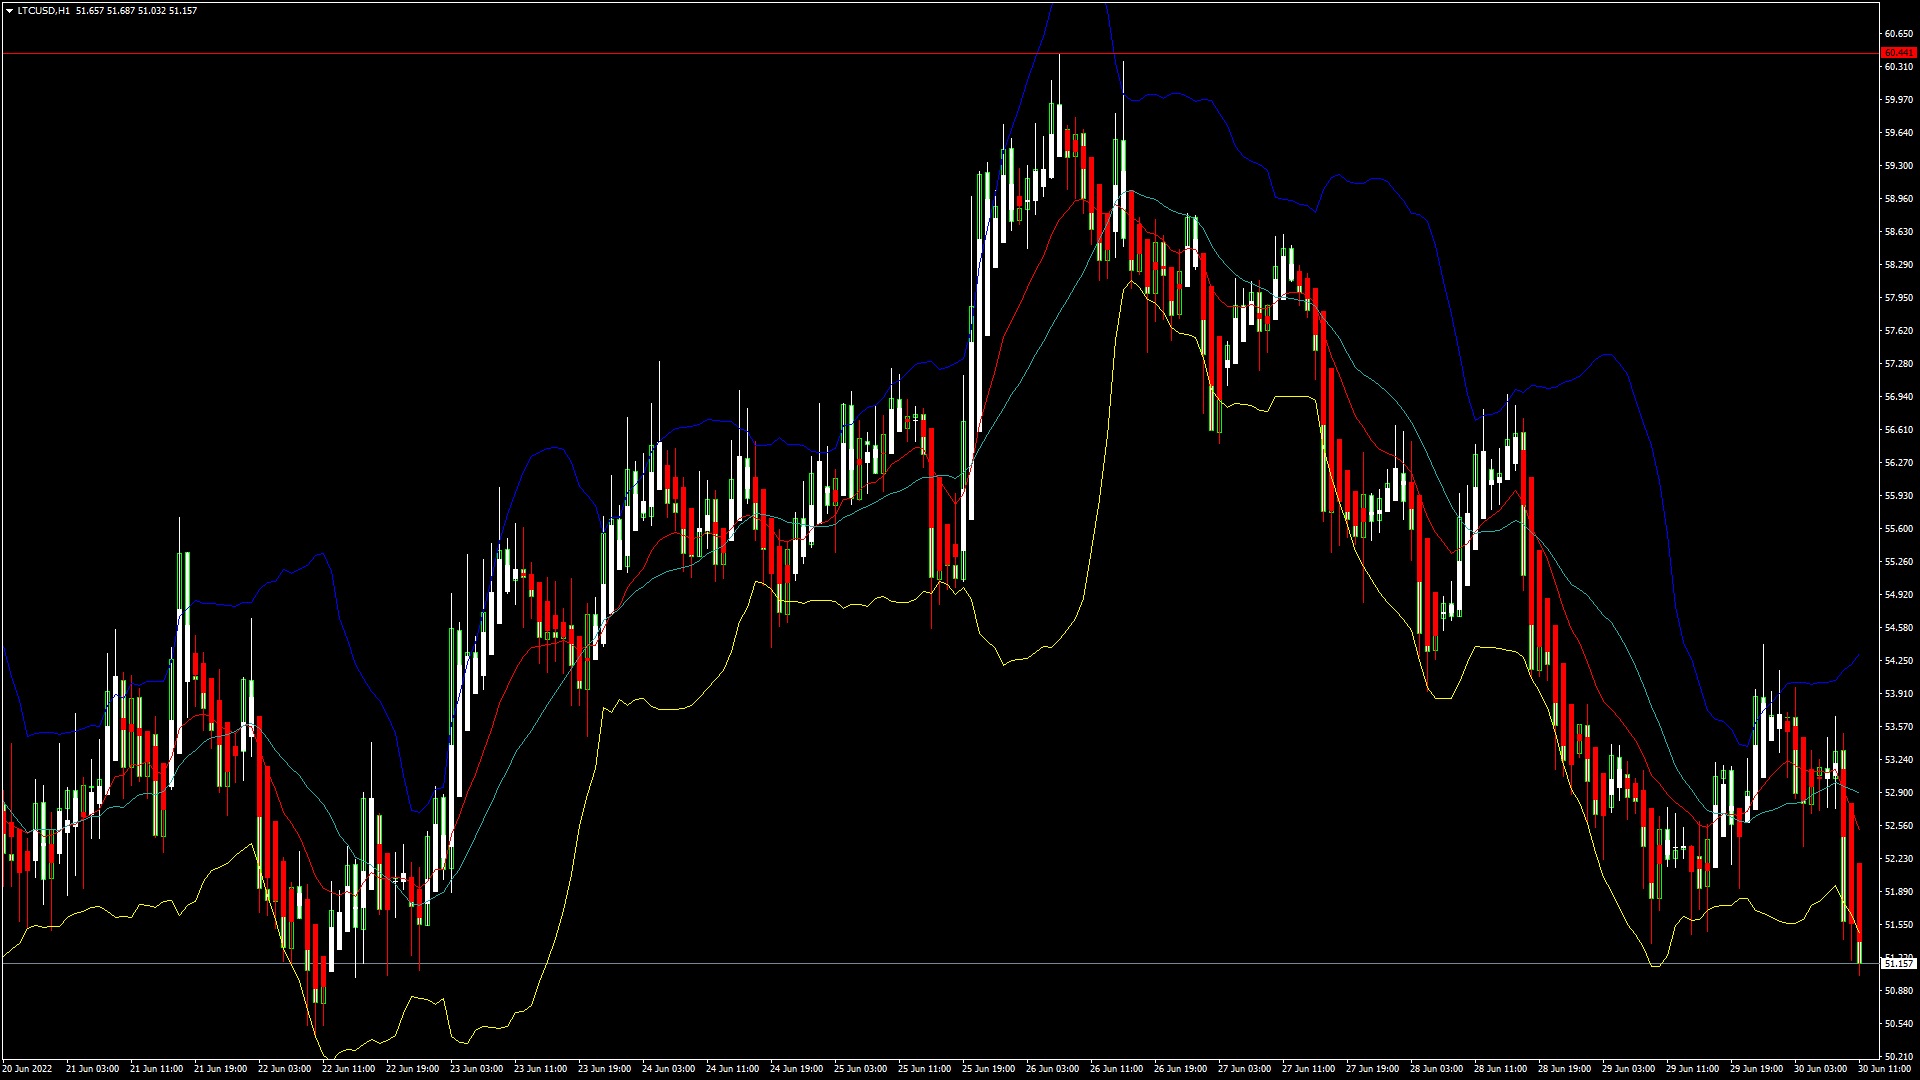
LTCUSD – Bearish Pin Bar Pattern Below $60
Litecoin was unable to sustain its bullish momentum last week and after touching a High of 60.44 on 26th June started to decline heavily against the US Dollar.
We can see the formation of Moving Average Bearish crossover pattern of MA20 and MA50 in the 30 minutes timeframe indicating the Downtrend.
We can clearly see a Bearish Pin Bar Pattern Below the $60 handle which is a Bearish pattern and signifies the end of a Bullish phase and the start of a Bearish phase.
Litecoin is now trading Below its 100 hourly Simple moving averages and 200 hourly Exponential moving averages. The price of LTCUSD is just Below its Pivot levels of 51.61
Relative Strength Index is at 33 indicating a WEAK market, and the continuation of the selling pressure this week.
The prices of Litecoin continue to remain Below all of the Moving Averages, which are now giving a STRONG SELL Signal at current market levels of 51.27
Both the STOCHRSI and Williams Percent Range are indicating Oversold levels, which means that the prices are due to correct Upwards in the short-term range.
The Short-Term outlook for the Litecoin has turned Strong BEARISH.
- ALL of the Technical Indicators are giving a STRONG SELL Signal.
- Litecoin Bearish Reversal seen Below the $60 levels.
- Average Directional Change is indicating a Neutral market.
- Average True Range is indicating HIGH Market Volatility.
Litecoin Bearish Reversal Seen Below $60
We can see that the prices of Litecoin continue to fall and are now trading below the $52 handle in the European Trading session today.
The Commodity Channel Index is indicating Oversold levels which means that the prices are due for an Upwards correction.
Litecoin failed to clear its resistance above $60 and now we are looking at $50 and $48 as the immediate targets.
The price of LTCUSD is now facing its Classic support levels of 50.79 and Fibonacci support levels of 51.38 after which the path towards $50 will get cleared.
The Daily RSI is printing at 42 which is indicating a Neutral market and the continuation of the selling pressure in the medium-term range.
LTC has decreased by 2.01% with a price change of 1.05$ in the past 24hrs and has a trading volume of 0.587 Billion USD.
Litecoin trading volume has increased by 7.40% as compared to yesterday which appears to be Normal.
The Week Ahead
The prices of Litecoin need to remain above the $50 handle for any bullish correction in its levels in the next week.
Litecoin is expected to gain some Bullish traction next week after this decline and we are looking at the possible targets of $55 and $58.
The short-term outlook for Litecoin has turned as STRONG BEARISH, the medium-term outlook is NEUTRAL, and the long-term outlook is NEUTRAL at present market conditions.
In this week we are looking at levels of $50 to $55 and in the next week Litecoin is expected to consolidate at levels above $55.
Technical Indicators:
Relative Strength Index(14days): It is at 33 indicating a SELL.
STOCH (9,6): It is at 40.61 indicating a SELL.
Rate of Price Change: It is at -3.13 indicating a SELL.
Ultimate Oscillator: It is at 42.08 indicating a SELL.
FXOpen offers the world's most popular cryptocurrency CFDs*, including Bitcoin and Ethereum. Floating spreads, 1:2 leverage — at your service (additional fees may apply). Open your trading account now or learn more about crypto CFD trading with FXOpen.
*Important: At FXOpen UK, Cryptocurrency trading via CFDs is only available to our Professional clients. They are not available for trading by Retail clients. To find out more information about how this may affect you, please get in touch with our team.
This article represents the opinion of the Companies operating under the FXOpen brand only. It is not to be construed as an offer, solicitation, or recommendation with respect to products and services provided by the Companies operating under the FXOpen brand, nor is it to be considered financial advice.
Stay ahead of the market!
Subscribe now to our mailing list and receive the latest market news and insights delivered directly to your inbox.


Latest articles

US Dollar Index: A Defining Week for the King of the Markets
The dollar heads into a pivotal week trading near 101.80, just off a 15-month high, with the Fed's July 29 meeting standing as the clear focal point. Markets currently price roughly a 65% chance of a hold, though renewed

NZD/USD: Inflation Surge Meets Strong US Dollar Pressure
On 21 July, Stats NZ reported an acceleration in inflation: the Consumer Price Index rose 1.5% in the second quarter, while the annual inflation rate climbed to 4.1%, its highest level in more than two years and slightly

Weekly Market Insights with Gary Thomson: The Week of Central Banks and Earnings
In this video, we’ll explore the key economic events and market trends, shaping the financial landscape. Get ready for insights into financial markets to help you navigate the week ahead. Let’s dive in!
In this episode of Market