


Fibonacci Ratios to Use With the Elliott Theory
FXOpen

The Elliott Wave Theory was developed in the first half of the 20th century. Ralph Elliott noted that the market forms corrective and impulsive waves when rising or falling.
Using an ingenious approach of interpreting market cycles, Elliott defined the waves within the overall theory. First, he split them into impulsive and corrective waves. Or, five-wave and three-wave structures.
Next, he further divided the corrective waves into simple and complex. By introducing a connecting wave, the x-wave, he successfully explained complex corrective waves forming in financial markets.
But perhaps the greatest innovation of the Elliott Theory was the introduction of Fibonacci ratios in the technical analysis. Cleverly, Elliott used them to set strict rules for both impulsive and corrective waves.
Fibonacci Ratios to Consider in Impulsive Waves
The 61.8% or the golden ratio is the most important Fibonacci level of them all. It appears both in impulsive and corrective waves.
In impulsive waves, traders use it to spot the 2nd wave pullback before the extended third wave. For instance, the market advances or declines and suddenly a counter move starts.
The second wave typically retraces between 50% and 61.8%, with the golden ratio being the entry point of a new Elliott trade. While the entry is at the 61.8% level, the stop-loss must be at the start of the impulsive wave. As for the take-profit, savvy traders use either a risk-reward ratio more significant than 1:3 (meaning the reward exceeds the risk by a factor of 3 to 1) or a Fibonacci ratio.
As the 3rd wave in an impulsive wave is most likely to extend, the minimum extension is 161.8% of the 1st wave. Therefore, traders use a Fibonacci tool (either the retracement or the expansion tool) to find out the minimum distance that the market must travel in the 3rd wave.
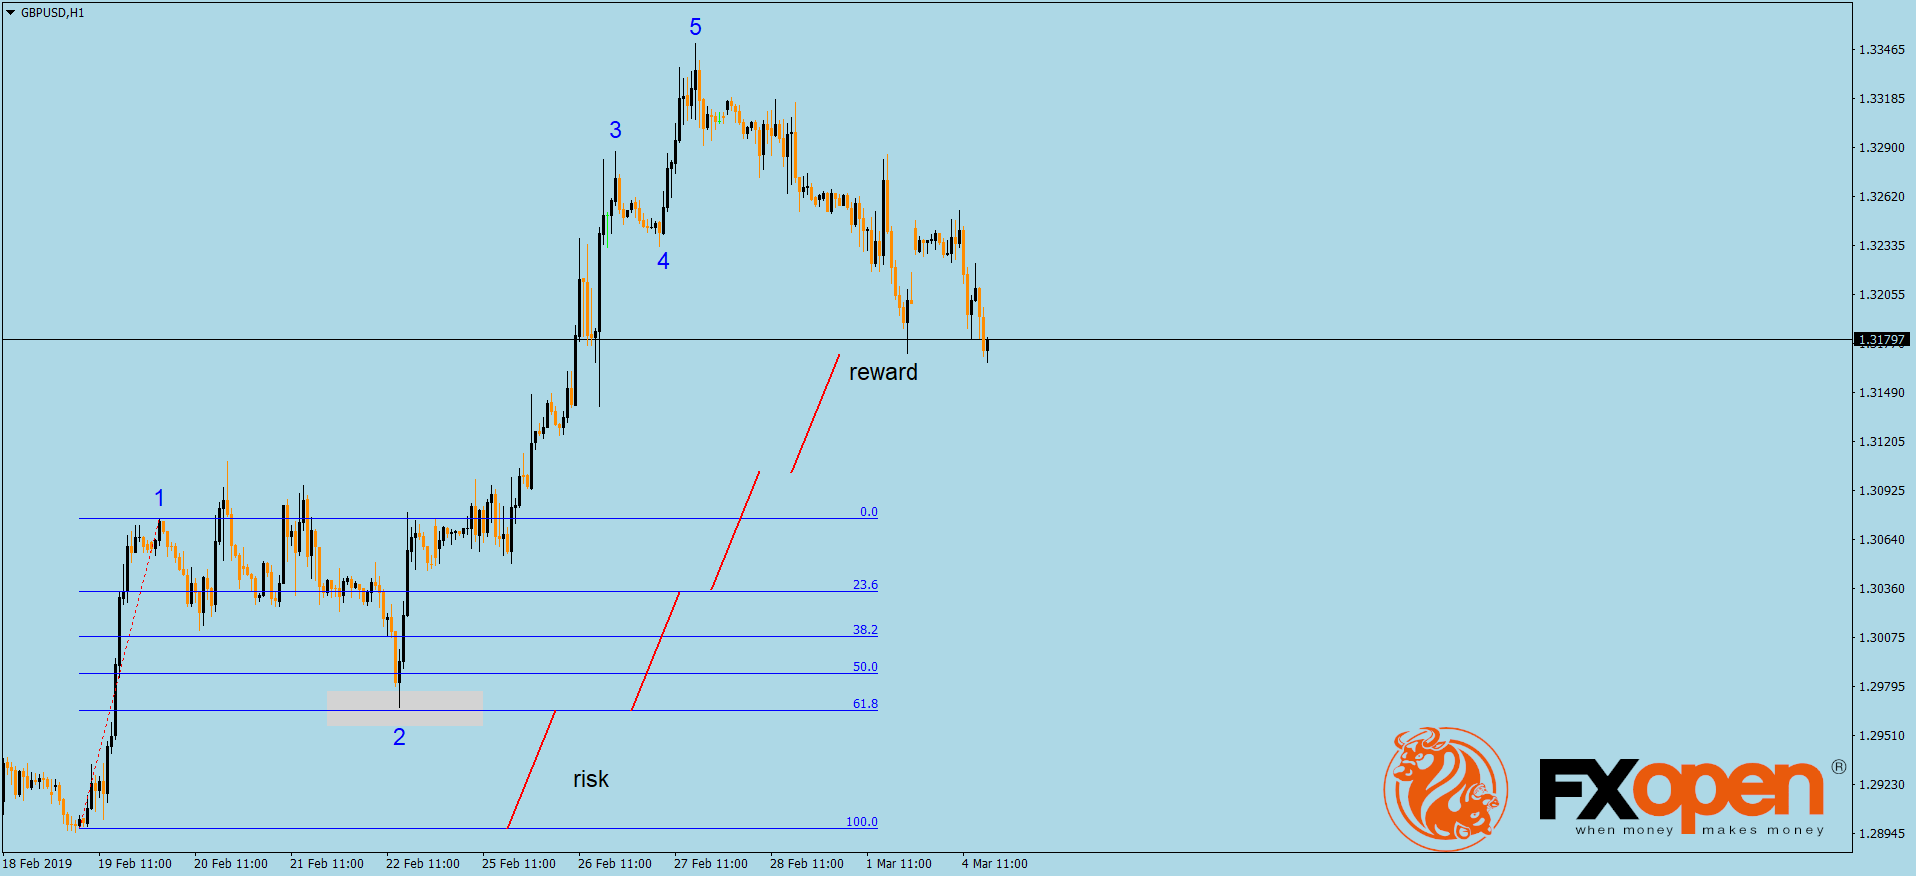
Other important ratios to consider when trading impulsive moves are:
- 2%
- While not mandatory, the 4th wave retraces between 23.6% and 38.2% of the 4th wave
- 8%
- In strong impulsive waves, the 3rd waves extend much more than the minimum 161.8% level, reaching 261.8% or even more
Fibonacci Ratios in Corrective Waves
Once again, the 61.8% retracement is key. The b-wave of a flat pattern must exceed this level, in order for the corrective wave to fall into the category of a flat.
In sharp contrast, a zigzag requires little retracement. The market must NOT retrace more than the golden ratio for the b-wave.
Instead, the 23.6% and 38.2% levels act as normal levels for the b-wave in a zigzag. If the price extends the retracement beyond the 38.2% level, the chances that the market forms a zigzag decrease significantly.
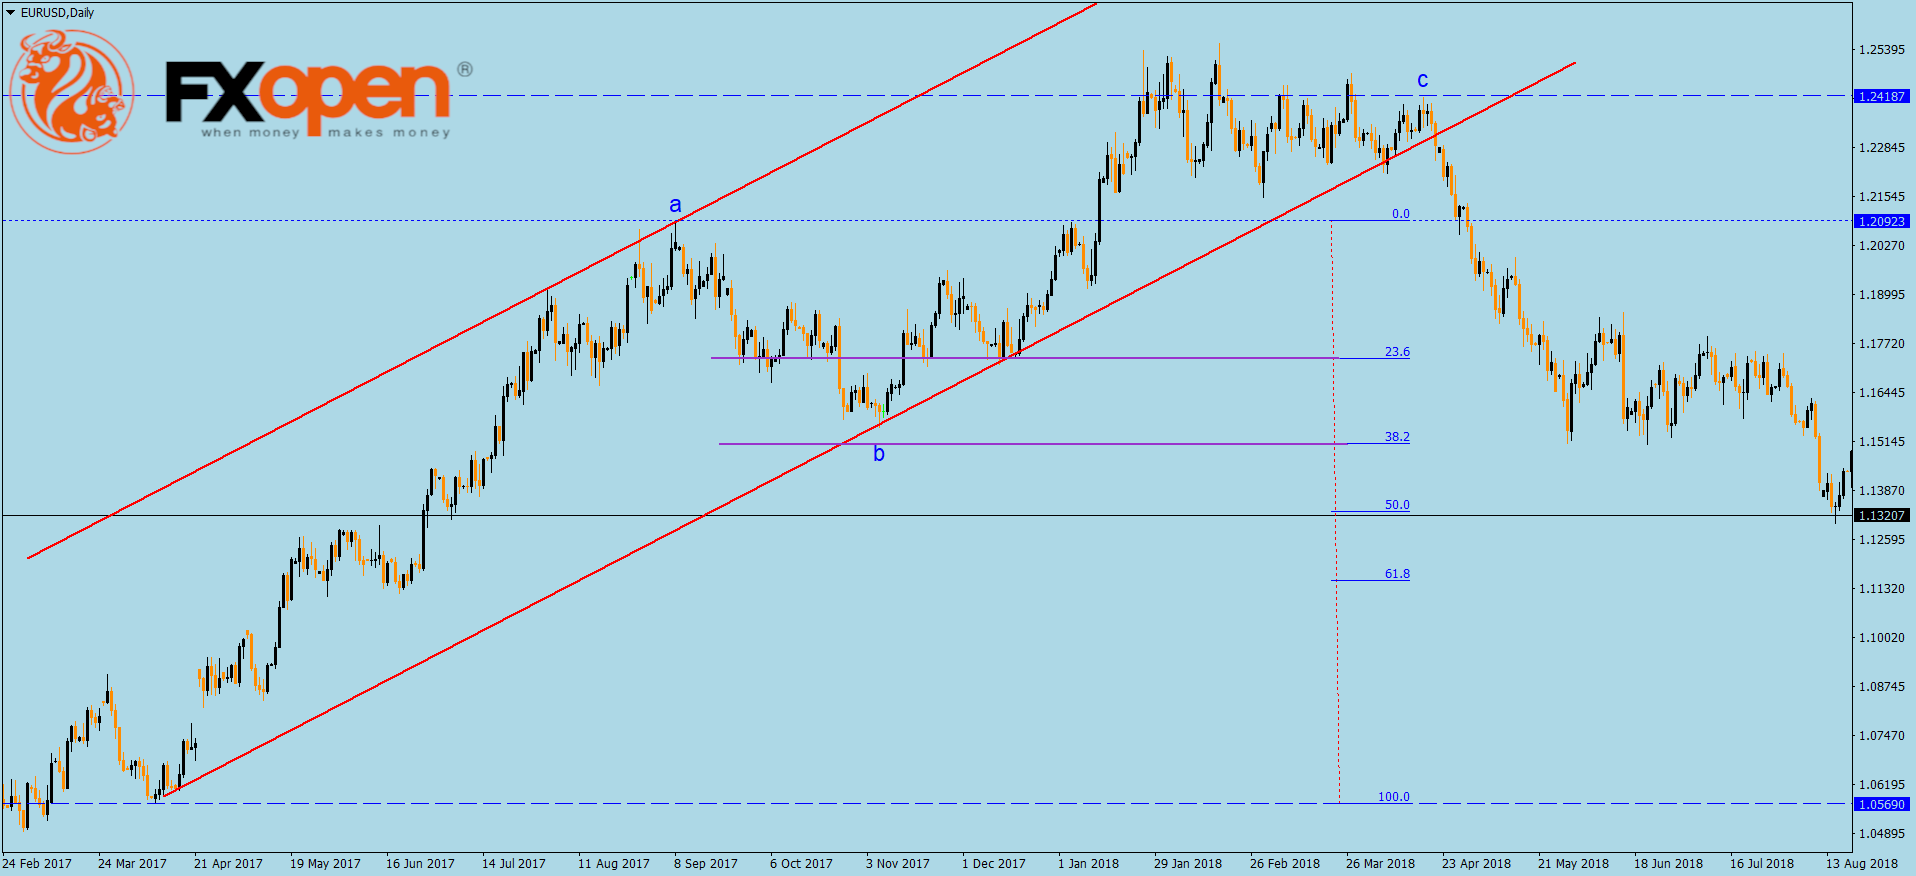
Other ratios to consider when labeling corrective waves:
- 6%
- If the b-wave of a flat pattern retraces more than 123.6% when compared with the previous a-wave, the c-wave is unlikely to retrace the b-wave
- 2%
- If the b-wave of a flat exceeds this level, the market forms an irregular flat
- 8%
- If the b-wave of a flat exceeds it, the market most likely forms a running flat
Conclusion
The Elliott Waves Theory as we know it today wouldn’t be possible without the Fibonacci ratios. Elliott used the ratios to set clear rules for corrective and impulsive waves. Without these rules, the theory simply would not exist.
This article represents the opinion of the Companies operating under the FXOpen brand only. It is not to be construed as an offer, solicitation, or recommendation with respect to products and services provided by the Companies operating under the FXOpen brand, nor is it to be considered financial advice.
Stay ahead of the market!
Subscribe now to our mailing list and receive the latest market news and insights delivered directly to your inbox.


Latest articles

EUR/JPY: Yen Recovers April Losses as the Market Searches for a New Equilibrium
Fundamental backdrop
In late April 2026, Japan’s Ministry of Finance moved from verbal warnings to direct action, carrying out a currency intervention worth roughly ¥5.5 trillion ($35 billion) — the first since July 2024. The move was triggered by

Market Analysis: GBP/USD Turns Bullish Again While EUR/GBP Drops More
GBP/USD is showing positive signs above 1.3440 and 1.3460. EUR/GBP declined and is now consolidating losses below 0.8680.
Important Takeaways for GBP/USD and EUR/GBP Analysis Today
· The British Pound started a fresh increase
Netflix 2026: Reversal on the Deal, Pullback on Earnings
Fundamental Background
At the end of February, Netflix withdrew from the bid for Warner Bros. Discovery assets after WBD’s board deemed Paramount Skydance’s $31-per-share offer more attractive. Netflix chose not to raise its own bid of $27.75