


How to Trade 5th Wave Failures
FXOpen
Failures are interesting and, at the same time, powerful concepts within Elliott Wave Theory. They have a predilection of forming during corrective activity, but also impulsive waves can “fail.”
Before anything, let’s review a bit the main idea of the Elliott theory. By counting corrective and impulsive waves, traders label the market and forecast future prices.
Elliott laid rules for all market moves and used numbers to count impulsive waves and letters for corrective waves. He called the first ones five-wave structures (1-2-3-4-5) and the second ones three-wave structures (a-b-c).
The idea is that together, the impulsive and corrective waves form different cycles of various degrees. Their integration is the key to correctly labeling the market swings.
What Is a Failure?
According to Elliott, failure happens when the market can’t make a new high or low anymore. Typically failures form during corrective activity, like in flat patterns, but they appear in impulsive waves too.
Failure is a very powerful sign that the market gives. It shows counter-trend strength, and most of the times it marks a significant top or bottom.
In a flat pattern, the c-wave is the one that fails. It can’t retrace beyond the start of the previous b-wave, and, depending on its length and the trend type, it marks a bottom or a top.
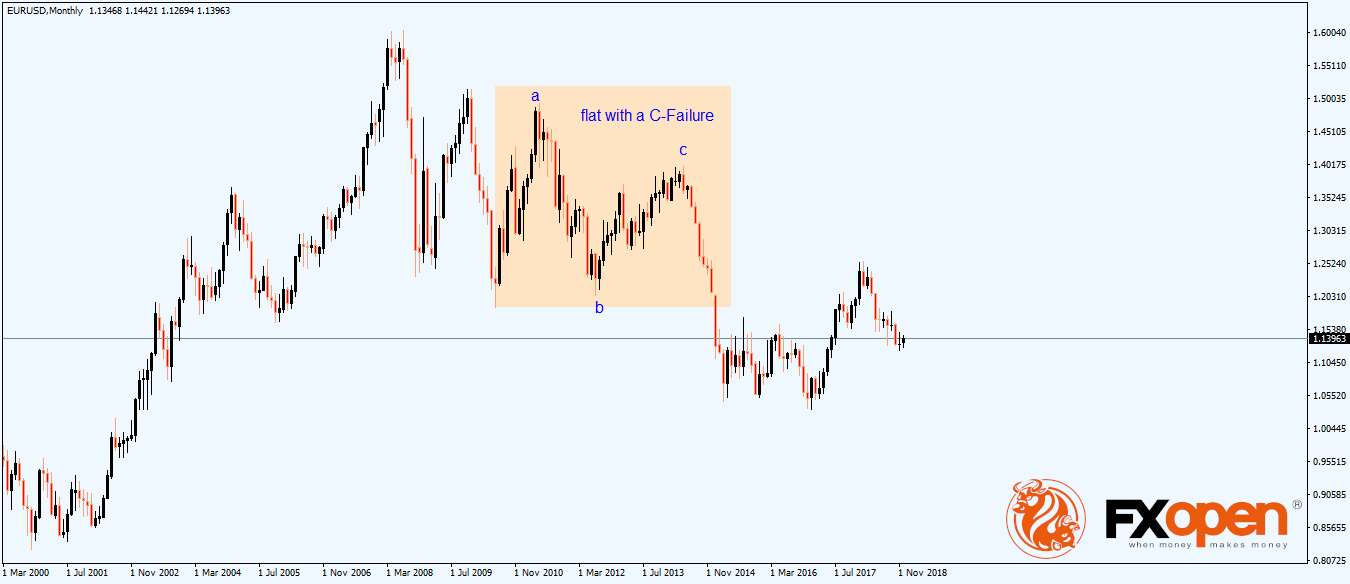
A classic flat with failure is shown above. The c-wave shows terminal activity and fails to break the previous high marked at the start of the b-wave or the end of the a-wave. That’s a sign of counter-trend strength, and the market dived subsequently.
Explaining a Fifth Wave Failure
A fifth wave failure is even more powerful. It refers to the unusual situation when the fifth wave in an impulsive move fails to make a new high (in a bullish trend) or low (in a bearish trend).
During a classic impulsive wave, the five-wave structure looks like below. This is the EURAUD chart showing an impulsive activity on the weekly timeframe, part of a bigger degree cycle.
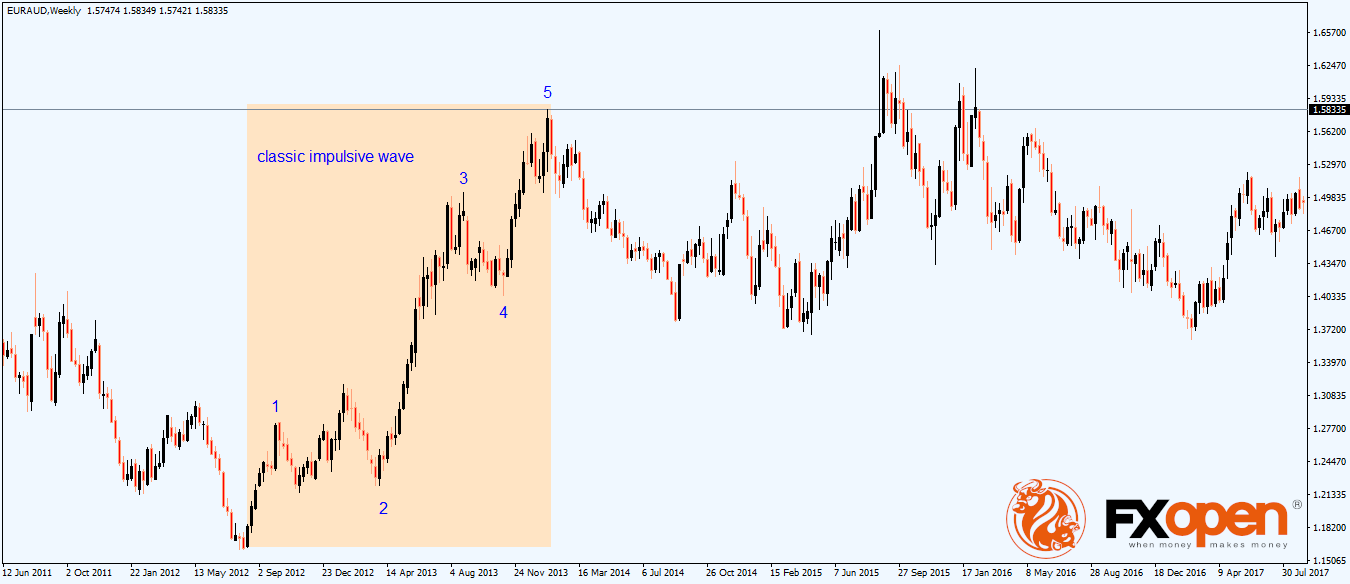
Note the extended wave (the longest in the structure, the third wave) and the fifth wave that makes a new high. Hence, no failure here.
If there’s a failure, on a lower degree on the second wave, we can note that the last swing doesn’t make a new low. Therefore, it fails, shows a sign of counter-trend strength, and the “explosion” higher forms the extended wave.
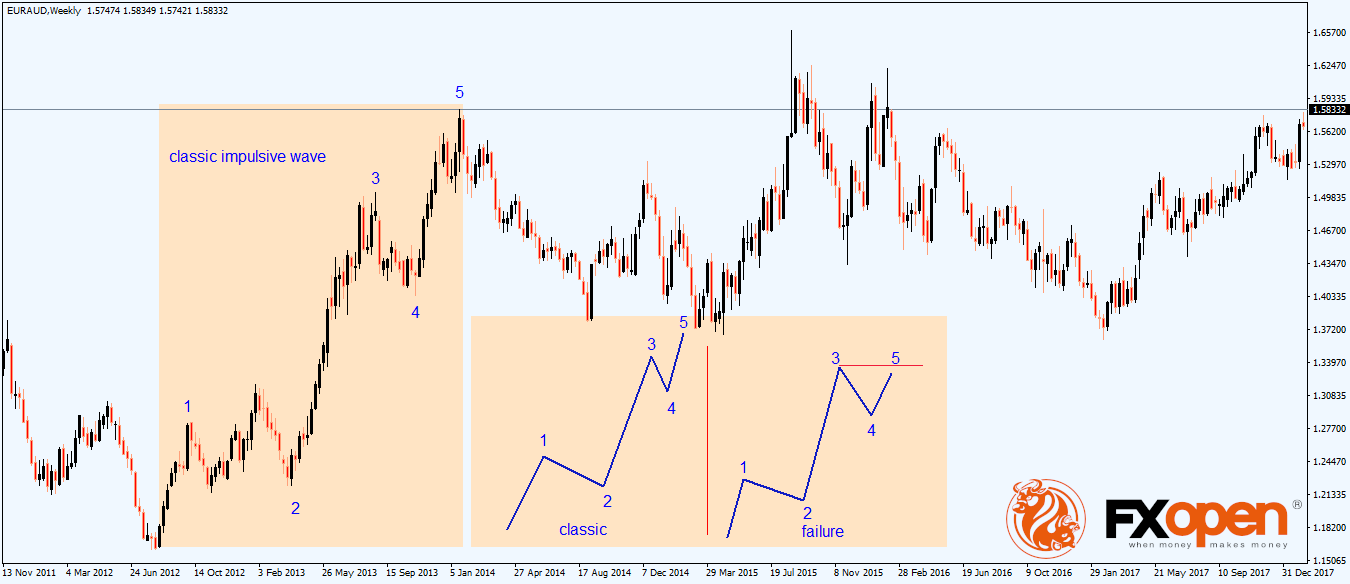
To better explain the fifth wave failure, the chart from above shows what the conditions for it are. As it can be seen, the last wave of the structure fails to make a new high, marking a top.
A fifth-wave failure is a rare structure. When it forms, traders will notice it after the fact. However, it is not late as the top or bottom gives the right market direction.
One thing to keep in mind when labeling a fifth wave failure: the first wave’s length is similar to the fifth wave. Without this small condition, the market move is not a fifth wave failure.
Conclusion
To sum up, look for major tops and bottoms to remain in place after a fifth wave failure. If anything, the counter-trend move will be more aggressive than even the extended wave in an impulsive structure.
This article represents the opinion of the Companies operating under the FXOpen brand only. It is not to be construed as an offer, solicitation, or recommendation with respect to products and services provided by the Companies operating under the FXOpen brand, nor is it to be considered financial advice.
Stay ahead of the market!
Subscribe now to our mailing list and receive the latest market news and insights delivered directly to your inbox.

Latest articles

US Dollar Strengthens Amid Equity Market Weakness and Hawkish Fed Rhetoric
The US dollar continues to hold firm near multi-year highs as sentiment across equity markets deteriorates and investors increasingly expect the Federal Reserve to maintain a restrictive monetary policy stance for longer. The US economy remains resilient, while inflation risks

Bitcoin: Corrective Channel Broken as Traders Turn More Active
Bitcoin has come under the influence of several factors simultaneously. The wave of selling at the beginning of June was linked to Strategy's first disclosed Bitcoin sale in several years, a prolonged series of outflows from spot ETFs, and a

DAX 40: consolidation amid technology sell-off
A wave of selling in the technology sector that emerged earlier this week has weighed on European equities. The trigger was investor concern over the profitability of large-scale debt-funded investments by major US tech companies in AI infrastructure. The Nasdaq