


Top 3 Pullback Trading Strategies
FXOpen

As traders, we all know the market can be unpredictable, but by understanding and utilising pullback trading strategies, we can take advantage of temporary price reversals to enter positions at more favourable prices. In this article, we’ll dive into the world of pullback trading, explain the concept of mean reversion, and look at how to use tools like the moving average indicator and Fibonacci retracements to identify potential pullback levels.
What Is a Pullback?
In the past, you might have seen stock traders discussing their plans to wait for a pullback to load up on shares and wondered, “but what is a stock pullback?” In fact, pullbacks occur in prices of all tradable assets, including commodities and forex trading pairs, such as EUR/USD and AUD/USD, not just in stock prices.
A pullback refers to a temporary reversal in the price of an asset after a period of upward or downward movement. If you’ve ever heard of “correction” or “retracement,” these are just other terms used to describe pullbacks. It's where the price cools off slightly before continuing its overall trend, and it is often the result of profit-taking by traders and technical factors, like key areas of support and resistance.
Why Do Pullback Trading Strategies Work?
Trading pullbacks in trends plays into the notion that “the trend is your friend.” In other words, trading in the direction of the higher-timeframe trend will typically yield the best results. But why does this strategy work? The easiest way to think about it is in the context of “discount” and “premium” pricing.
Discount and Premium Pricing

Imagine you have a bullish trend, like the one in the example above. Here, traders run the risk of buying at one of the many highs that make up the trend, paying more for a single unit of an asset than is potentially necessary (paying a premium) and resulting in sub-optimal risk/reward. Given the premium pricing, the number of buyers will taper off until sellers take control and push prices lower.
Conversely, pullbacks allow traders to get in once the price cools off, meaning they can enter at a discount. At this point, buying pressure will be at its strongest as many know these low prices often won’t last and that they can offer much better risk/reward ratios, maximising the profit for traders from the overall bull trend.
Mean Reversion
This concept relates to the idea of mean reversion, which states that prices tend to return to their average over time. By entering a position during a pullback, traders can buy an asset at a lower price, or at a discount, with the expectation that the price will eventually return to its average.
Notice that in the chart above, for example, the retracements typically fall below the midpoint of the previous retracement and the 50-period moving average before continuing higher. Additionally, we can see that the further the price moves away from these two averages into areas of previous premium or discount, the more likely it is to reverse.
As you’ll see, these ideas form the basis for several commonly used pullback trading strategies. Understanding how the concepts work, however, will help you develop your skills as an effective pullback trader and allow you to trade under a variety of market conditions.
Using Pullback Strategies in Forex and Other Markets
The following strategies can form the basis of a solid stock pullback strategy, but their uses aren’t limited to just stocks. You can use them while forex trading or in the commodities and crypto* markets. Just note that pullback trading will be most effective in trending markets and less so in ranges.
To get the best understanding of how these strategies work, you can try applying them to live charts using the TickTrader platform.
Strategy #1: Moving Average Pullback Strategy
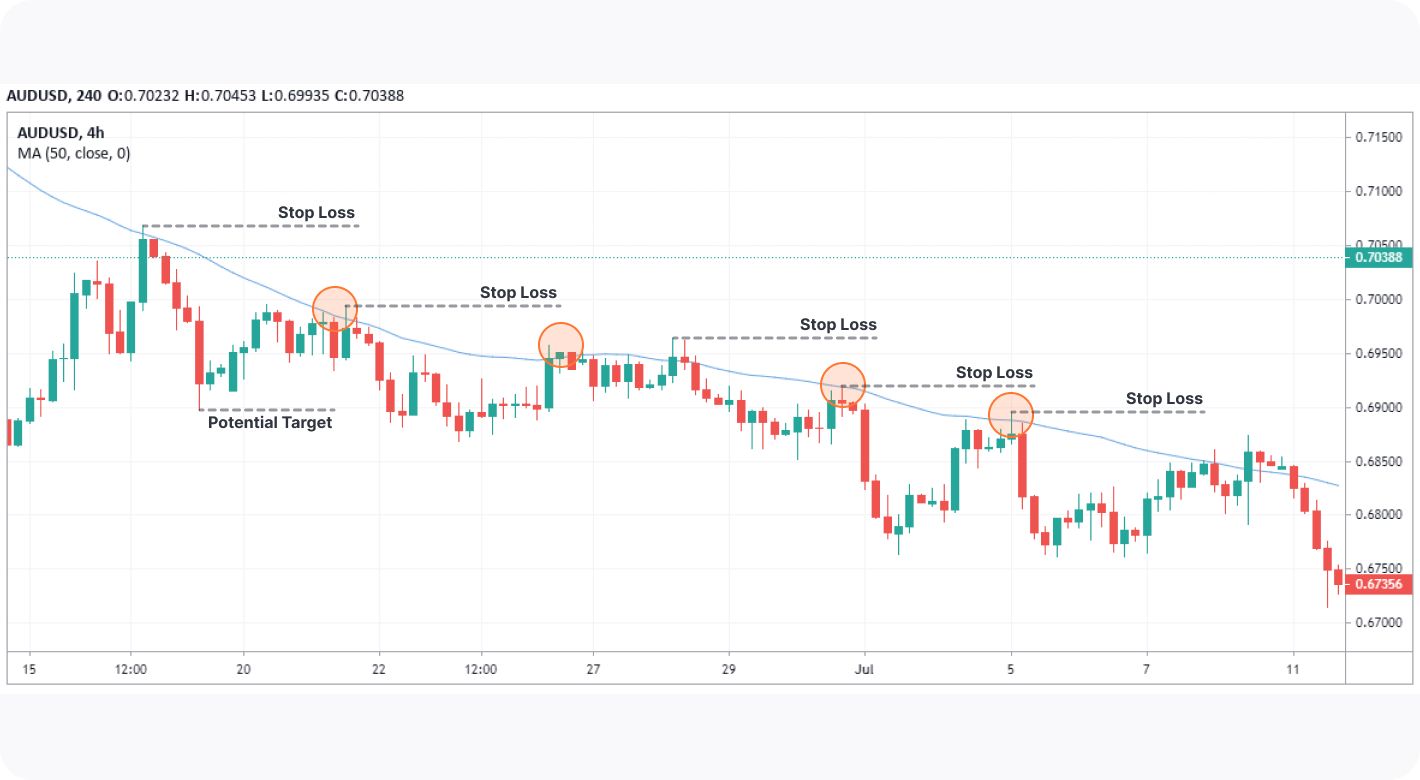
Using the principle of mean reversion, we can start putting it into practice with moving averages. Moving averages often provide ideal areas of dynamic support and resistance and are a versatile tool in any pullback trader’s arsenal.
Requirements: You can use a simple moving average (SMA) or an exponential moving average (EMA), which gives more weight to recent prices. It may be a good idea to try experimenting with both to see which one you prefer.
Traders often use a 21, 50, or 200-period moving average, so again, you can try experimenting to find the most suitable one for you. We’ll use a 50-period MA, expressed as MA (50).
Entry: First, a trend will need to have been set in motion. Traders usually either set a limit order at the moving average or enter with a market order based on price action that supports their idea.
Stop Loss: Stop losses are typically set above the high or below the low that originated the leg before the pullback, as seen in the example above. Given that these trends can last for a long time, you may trail your stop just above or below key swing highs and lows as the trend progresses.
Take Profit: Some traders begin to take profits at the high or low that originated the retracement, denoted by “Potential Target” in the example. So, when entering during a bullish pullback in an overall bear trend, traders can use the low that started the retracement as their first target. Subsequent levels of support or resistance are also commonly used as profit targets.
Strategy #2: Fibonacci Retracement Pullback Strategy
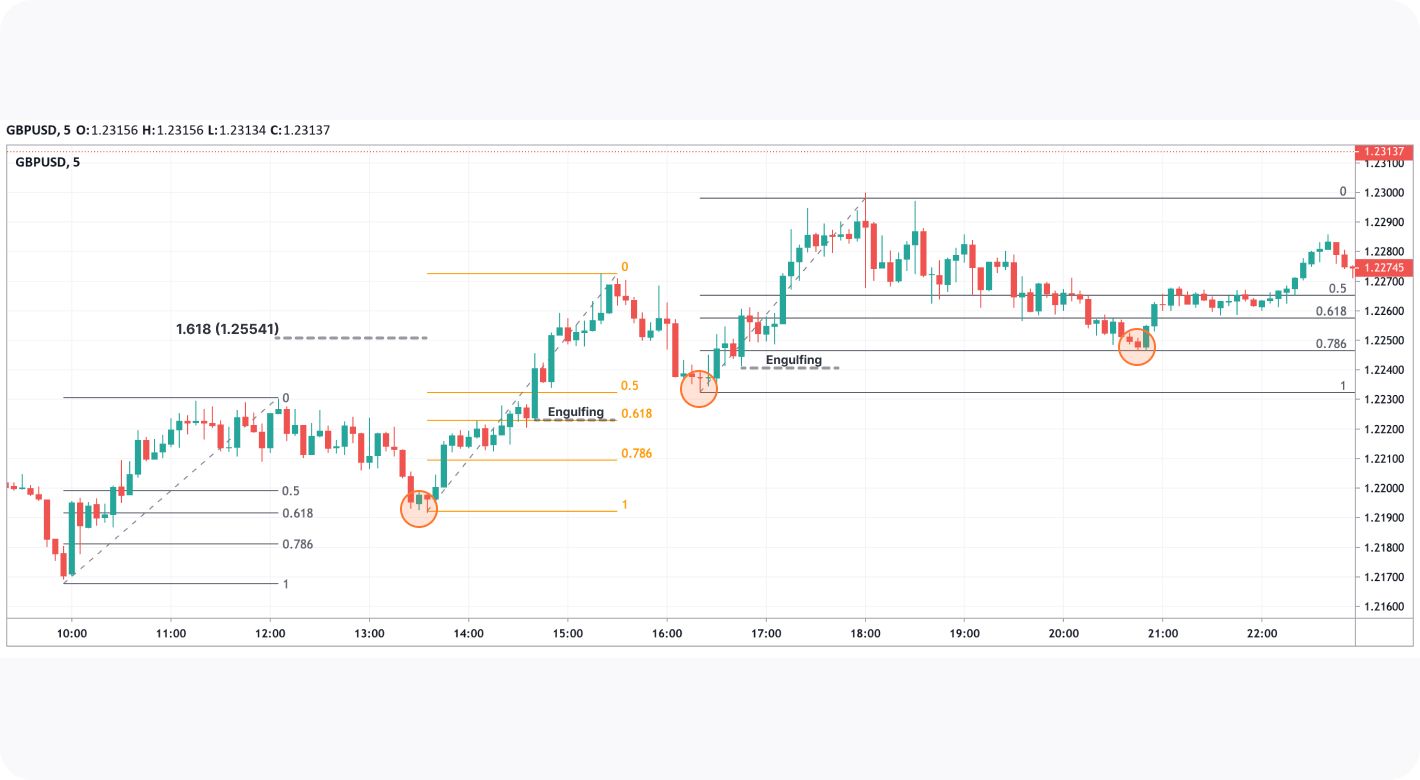
Using Fibonacci retracements is also a common way to find entries in pullbacks. Recall that the price will often cross above or below 50% of the retracement. Sometimes, it’ll reverse to the key Fibonacci levels of 0.618 and 0.786 in a larger bull trend or 0.382 and 0.236 in a bear trend. Don’t forget that 0.5 itself is a Fibonacci level.
Requirements: You just need the Fibonacci retracement tool that can be found in most charting software, like TickTrader. In a bullish trend, apply the first point to a swing low and the second to a swing high. Apply it to a swing high and low for a bear trend.
Entry: Entries here can be adjusted to your preferred style of trading. Some traders will simply set a limit order at 0.5, while others will place them at 0.786 or 0.236 to maximise risk/reward. Alternatively, you can break up your order into three, setting limits at 0.5, 0.618, and 0.786 to cover all bases for a bullish trade or 0.5, 0.382, and 0.236 for a bearish one.
Stop Loss: Like the Moving Average strategy, traders often put a stop loss above the high or low that originated the leg before the pullback. For instance, the second entry above would mean placing the stop at the 0.618 level of the Fibonacci retracement. You can also try putting stops above or below nearby engulfing candles for better risk/reward. Alternatively, you could choose to trail your stop below swing lows or above swing highs for bullish and bearish trades, respectively.
Take Profit: Some traders will start taking profits at the nearest major swing points, while others use the 1.618 extension of the pullback to set their profit target.
Strategy #3: Breakout Strategy
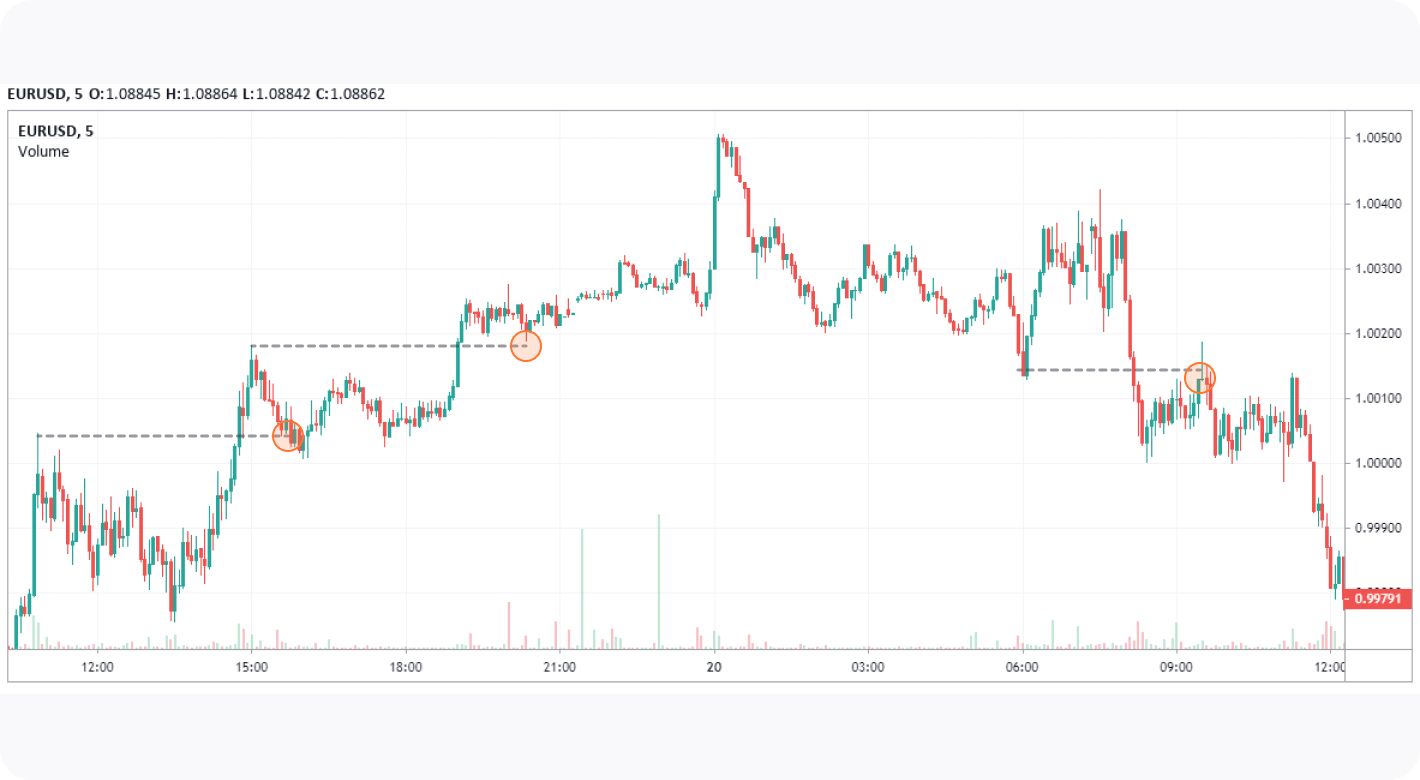
Finally, in markets where the overwhelming trend is too strong to allow for a deeper pullback, you may try to trade the breakout. In a bullish breakout, for example, the price might quickly back up to test the resistance-turned-support before shooting higher. Note that some breakouts are merely false breaks designed to trap traders and force prices into a deeper retracement - just look at the significant highs in the first picture in this article.
To counteract these traps, you can look for high volume on the movement that caused the break, as well as the close of the candle. Candlestick patterns, such as shooting stars and hammers, can typically signal false breaks.
Entry: After a bullish breakout above a recent swing high on high volume, traders will usually set a limit order at or just above the high or wait for price action to confirm that the high is now acting as support before entering with a market order. Conversely, traders will enter in the same way for a bearish breakout but use swing lows instead, setting orders at or just below the low or looking for price action confirmation to enter.
Stop Loss: Traders can choose to set stops below the range that the breakout occurred from or above or below an engulfing candle, like in the Fibonacci strategy.
Take Profit: As with the two strategies mentioned, some will just trail their stops above or below key swing highs and lows to ride the long-term trend and maximise their profits. Others choose to use the most recent swing high or low to take partial profits before closing their position at a suitable level of risk/reward.
Closing Thoughts
Pullback trading can be an effective strategy for traders looking to ride trends. By taking advantage of the concepts of premium/discount pricing and mean reversion and using technical analysis tools like moving averages and Fibonacci retracements, traders can get involved at optimum points in the market before the trend continues.
It’s also worth remembering that any pullback can signify a market reversal. Always be cautious and use these pullback strategies in conjunction with other forms of technical analysis before considering making a trade. Once you feel ready, you can try opening an FXOpen account to put your skills to the test. Happy trading!
*At FXOpen UK, Cryptocurrency CFDs are only available for trading by those clients categorised as Professional clients under FCA Rules. They are not available for trading by Retail clients.
This article represents the opinion of the Companies operating under the FXOpen brand only. It is not to be construed as an offer, solicitation, or recommendation with respect to products and services provided by the Companies operating under the FXOpen brand, nor is it to be considered financial advice.
Stay ahead of the market!
Subscribe now to our mailing list and receive the latest market news and insights delivered directly to your inbox.

Latest articles

GBP/USD and EUR/GBP Await Key Bank of England Decision
The pound strengthened following the outcome of the US Federal Reserve meeting, where the central bank, as expected, kept interest rates unchanged. However, the Fed did not provide the market with clear signals of an imminent shift towards rate cuts,

Microsoft Analysis: Earnings Beat Expectations
On 29 July 2026, Microsoft reported its results for the fourth quarter of fiscal year 2026. Revenue reached $90 billion, up 18% year-on-year, while adjusted earnings per share came in at $4.74, comfortably ahead of analysts' expectations of $4.

EUR/USD: All Eyes on the Fed as the Range Reaches Its Breaking Point
The dollar's next move hinges on tonight's Fed decision, and this time markets genuinely don't know what to expect. While economists still lean toward a hold—with CME FedWatch odds sitting near 68.5% for no change—Kevin Warsh's hawkish