


How to Trade with the Ultimate Oscillator
FXOpen

While there are many indicators out there, few incorporate multiple timeframes. The Ultimate Oscillator, with its multi-timeframe approach, is an effective tool for spotting divergences. In this article, we will break down how this indicator works, what signals it produces, and how it compares to other well-known oscillators.
What Is the Ultimate Oscillator?

The Ultimate Oscillator is a technical indicator invented by Larry Williams in 1976. It's designed to incorporate price action over three different timeframes – short-term (7-period), intermediate-term (14-period), and long-term (28-period) – to avoid the common pitfalls of a single timeframe strategy.
Rather than following the more conventional method of focusing solely on closing prices or the period's high and low, it uniquely incorporates buying pressure into its calculation. Buying pressure is essentially the difference between the close and the low of the period or the difference between the close of the previous period and the close of the current period, whichever is lower.
Like other oscillators, the Ultimate Oscillator has overbought and oversold levels. However, the main strength of this tool lies in identifying divergences between price and oscillator, which might suggest a potential trend reversal. Traders often prefer the Ultimate Oscillator for cryptocurrency*, stock, and forex trading, given its effective insights.
How to Calculate the Ultimate Oscillator
Calculating the Ultimate Oscillator involves several steps, each of which combines the concept of buying pressure and true range across three different timeframes. Here's a simplified breakdown:
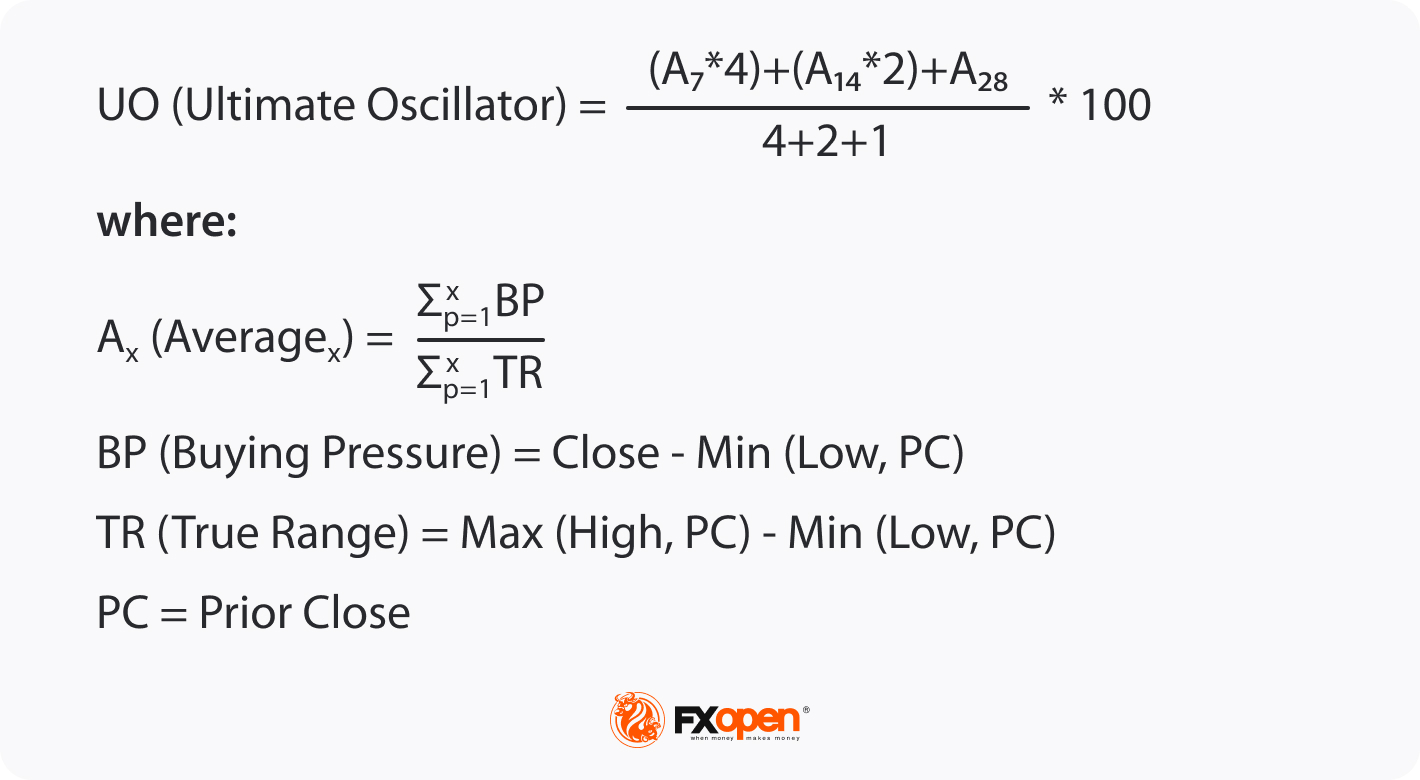
- Calculate Buying Pressure (BP): Subtract the minimum of the current low or the previous close from the closing price.
- Calculate True Range (TR): Choose the lowest value of the current period's low and the prior period’s close and subtract it from the current period's high or the prior period’s close, whichever is higher.
- Calculate the Average Buying Pressure and True Range: Over the past 7, 14, and 28 periods, sum the Buying Pressure and the True Range separately.
- Calculate the Buying Pressure Ratios: Divide the Buying Pressure sums by the True Range sums across each of the three periods.
- Calculate the Ultimate Oscillator: Use the formula [(7-period Buying Pressure Ratio * 4 + 14-period Buying Pressure Ratio * 2 + 28-period Buying Pressure Ratio) / (4+2+1)]*100.
As can be seen, the calculation of the tool is more involved than many other technical indicators, but its complexity is precisely what allows it to offer unique insight into price movements.
Luckily, with FXOpen’s free TickTrader platform, you don’t need to perform this calculation yourself. Head on over to TickTrader to get started with the Ultimate Oscillator in minutes.
Using the Ultimate Oscillator in Technical Analysis
Using the Ultimate Oscillator indicator involves understanding and interpreting the values it generates. The tool provides signals for potential price reversals based on divergence and the crossing of certain thresholds.
Overbought and Oversold Levels
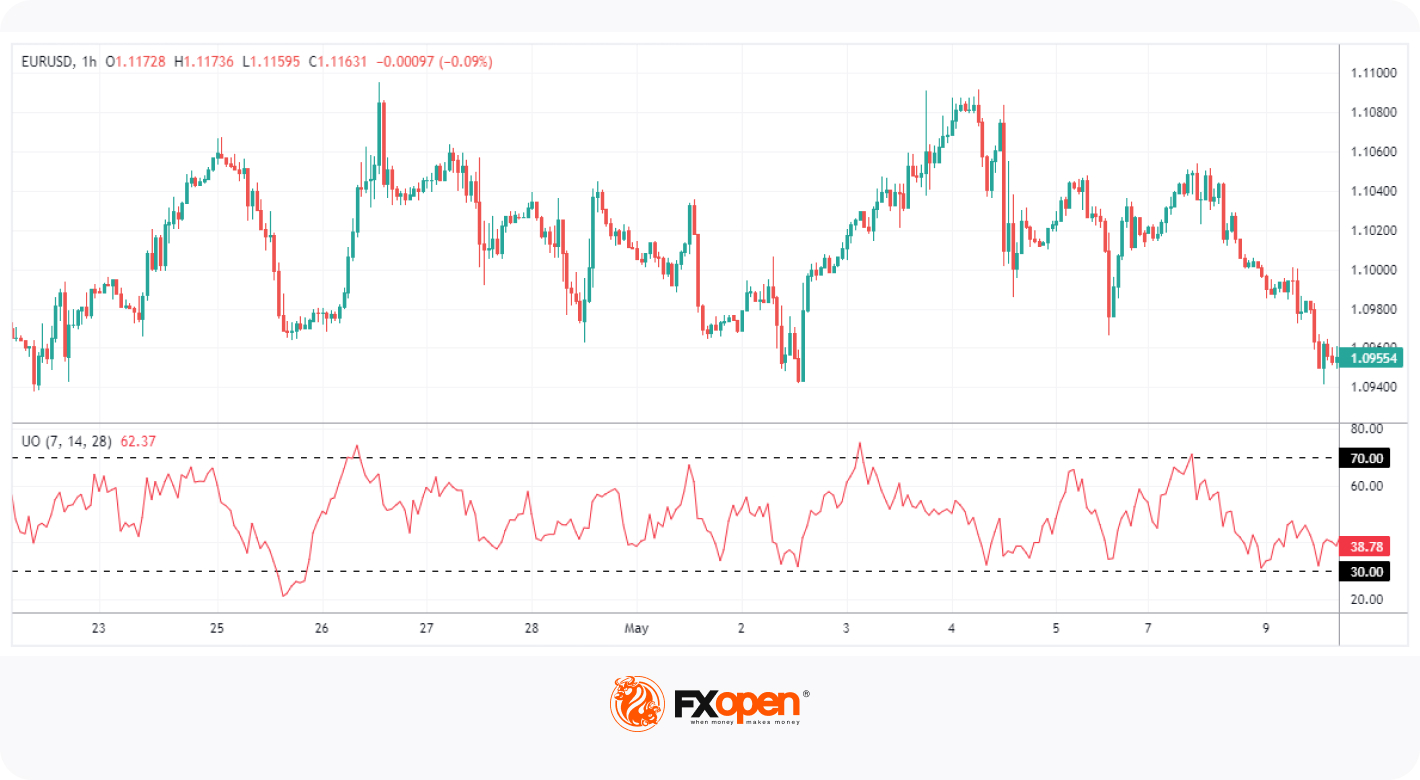
The Ultimate Oscillator moves up and down between 0 and 100. When its value surpasses 70, it indicates overbought conditions, suggesting an impending price drop. Conversely, levels below 30 point to oversold conditions, hinting at an imminent price rise. However, in strongly trending markets, these levels may remain overbought or oversold for extended periods, so it's important not to rely solely on these thresholds for trading decisions.
Also, traders use the 50 point to open buy and sell trades. When the Oscillator breaks above 50, it’s considered an opportunity to go long. Conversely, a break below 50 is considered an opportunity to go short. However, it’s vital to combine this signal with other technical analysis tools.
Bullish and Bearish Divergences

The real strength of this tool lies in spotting divergences. Divergences occur when the price of an asset is moving in the opposite direction of the oscillator.
A bullish divergence occurs when the price makes new lows, but the indicator fails to reach new lows. The divergence might be an indication that the downward momentum is losing strength, and a bullish reversal may be near.
A bearish divergence, on the other hand, happens when the price makes new highs, but the indicator fails to reach new highs. This can signal that the upward momentum is waning, and a bearish reversal may be on the horizon.
In both cases, traders often wait for a confirmation of the divergence before acting. This could be a subsequent move of the oscillator in the direction of the divergence or a break of a trendline/moving average.
Comparing the Ultimate Oscillator and Other Indicators
Comparing the Ultimate Oscillator with other popular technical indicators reveals specific distinguishing characteristics.
Ultimate Oscillator vs Stochastic Oscillator
The Stochastic Oscillator focuses on the position of the closing price compared to the range of high-low prices over a specified period. While it relies only on this single measure, the Ultimate Oscillator broadens its perspective by incorporating buying pressure and taking into account three separate timeframes.
Ultimate Oscillator vs RSI
The Relative Strength Index (RSI) measures momentum by comparing the magnitude of recent gains to recent losses. Its calculations are based on a single timeframe, making it potentially more prone to false signals during volatile price movements. The Ultimate Oscillator's multiple timeframe structure helps to reduce the incidence of such false signals.
Awesome Oscillator vs Ultimate Oscillator
Developed by Bill Williams, the Awesome Oscillator determines market momentum by calculating the difference between simple moving averages with a period of 34 and 5. Its focus is mainly on confirming current trends or anticipating potential reversals. In contrast, the Ultimate Oscillator uses the concept of buying pressure and multiple timeframes to identify divergences and anticipate reversals.
The Bottom Line
The Ultimate Oscillator, with its distinctive three timeframe approach and incorporation of buying pressure, offers a unique perspective in technical analysis. While its complexity may be challenging for traders with little experience, its ability to identify potential divergences effectively makes it a powerful tool. Ready to put your Ultimate Oscillator knowledge into action? You can open an FXOpen account to start using it in over 600+ markets. Good luck!
*At FXOpen UK and FXOpen AU, Cryptocurrency CFDs are only available for trading by those clients categorised as Professional clients under FCA Rules and Professional clients under ASIC Rules, respectively. They are not available for trading by Retail clients.
This article represents the opinion of the Companies operating under the FXOpen brand only. It is not to be construed as an offer, solicitation, or recommendation with respect to products and services provided by the Companies operating under the FXOpen brand, nor is it to be considered financial advice.
Stay ahead of the market!
Subscribe now to our mailing list and receive the latest market news and insights delivered directly to your inbox.


Latest articles

Weekly Market Insights with Gary Thomson: The Week of Central Banks and Earnings
In this video, we’ll explore the key economic events and market trends, shaping the financial landscape. Get ready for insights into financial markets to help you navigate the week ahead. Let’s dive in!
In this episode of Market

Intel at a Crossroads: Earnings Beat Meets Technical Resistance
Intel has just delivered its strongest quarter in over fifteen years, and the market reaction says it all. Q2 2026 revenue surged 25% year-over-year to $16.1 billion, crushing the consensus estimate of $14.42 billion, while adjusted EPS of

Tesla: Complex Range Structure Breaks Down Following Quarterly Earnings
Tesla released its Q2 2026 results after the market closed on 22 July. Revenue increased 26% year-on-year to $28.24 billion, while vehicle deliveries reached a record 480,126 units. However, operating margin fell sharply to 1.4%, down from