


How to Use Stock Volume in CFD Trading
FXOpen
Volume is one of the fundamental aspects of all markets. If you're wondering, "What does volume mean in the stock market?," you're about to discover how this critical measure of shares traded can unlock deeper insights into market trends and investor behaviour. We delve into how to use stock volume to improve your trading, offering practical approaches for confirming market sentiment, trends, reversals, and more.
What Is Volume in the Stock Market?
The volume in the stock market definition refers to the total number of shares traded during a specific time frame. It's a vital indicator of market activity and investor interest in a particular stock.
High volume often signals strong investor interest and market movement, either upward or downward. Conversely, low volume may indicate decreased interest or uncertainty in a stock. In essence, it provides insights into sentiment, helps confirm trends, and aids in identifying potential reversals or breakouts.
As we walk through the varying insights volume offers stock traders, you may gain the best understanding by applying your knowledge to real-time charts. Head over to FXOpen’s free TickTrader platform to see how volume affects hundreds of unique stocks.
Volume and Market Sentiment
When considering volume in a stock, meaning its traded shares, its relationship with market sentiment becomes pivotal. This sentiment, essentially the collective attitude of traders towards a stock, is often inferred from volume patterns.
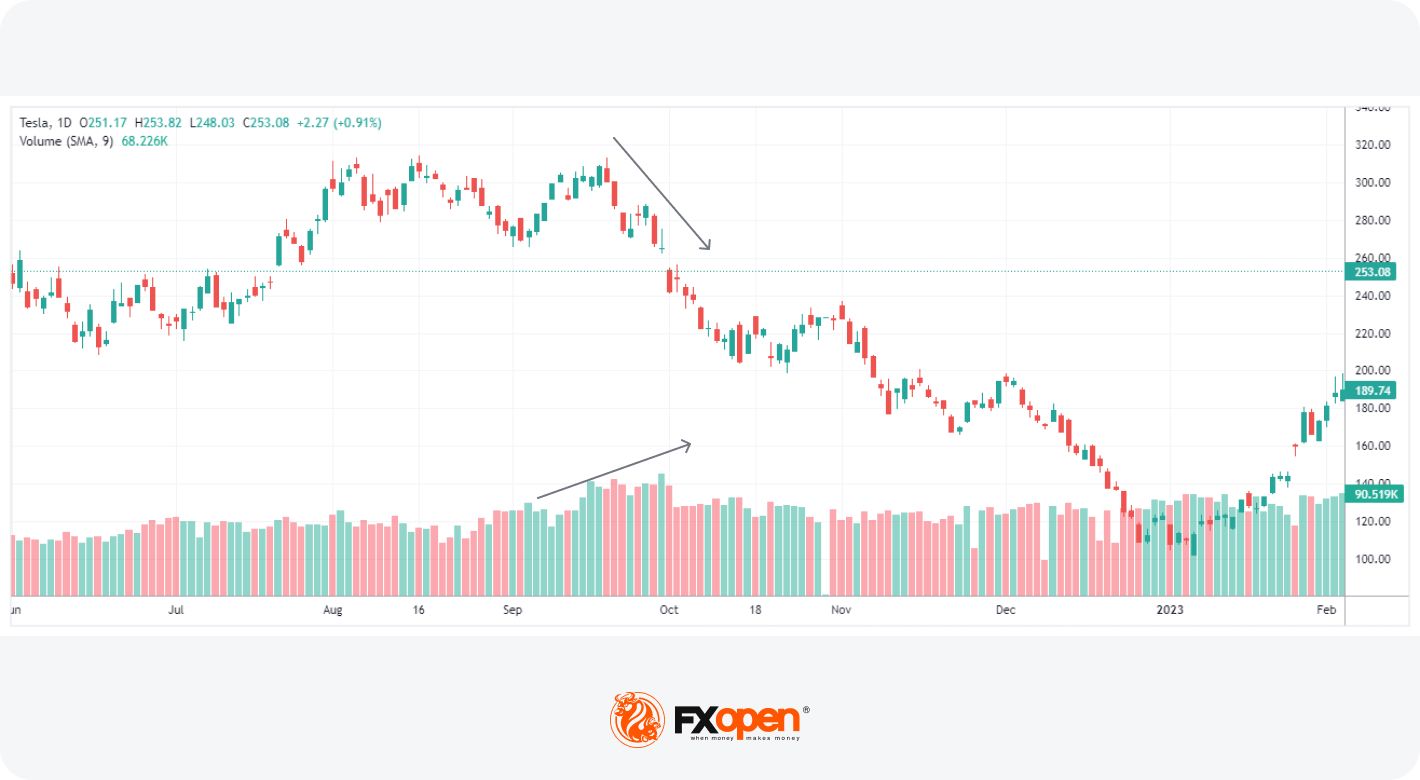
At its most basic, high trading activity during a stock's price increase is often seen as a confirmation of positive sentiment, showing trader confidence. Such a scenario often reflects a robust demand overpowering supply.
In contrast, if a stock declines on high volume, this may signal negative sentiment, suggesting a strong selling pressure. This situation typically indicates that investors and traders are actively offloading their shares.
Volume and Price Movement
So, how does volume affect stock prices? Volume acts as a force behind price movements, as discussed.
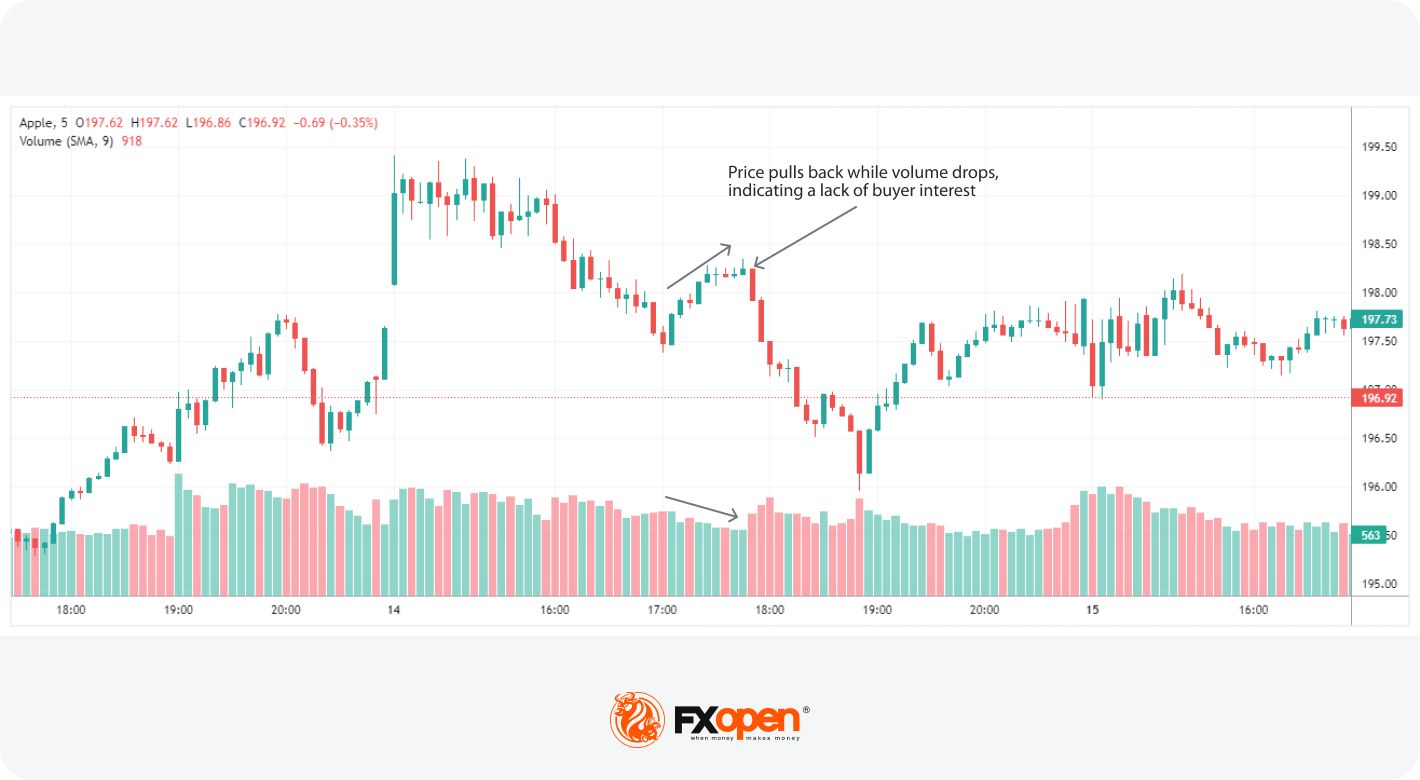
However, its impact isn't always straightforward. A stock might rise on low volume, which can be a sign of caution, as it may indicate a lack of conviction among traders, potentially making the price rise unsustainable. Similarly, a drop on low volume might not necessarily signify a bearish trend but rather a temporary lack of interest.
Additionally, the number of shares traded can be crucial in identifying a stock’s tops or bottoms. For instance, a sudden spike after a long period of price increase might signal a top, as it could represent a final push by exhausted buyers before a reversal. Similarly, a significant increase in market activity at a low could indicate a bottom.
Identifying Trading Signals with Volume
Learning how to trade volume involves recognising nuanced trading signals that volume fluctuations can offer. Beyond the basic interpretations of high or low volume, traders look for specific patterns or anomalies in activity data to make informed decisions.
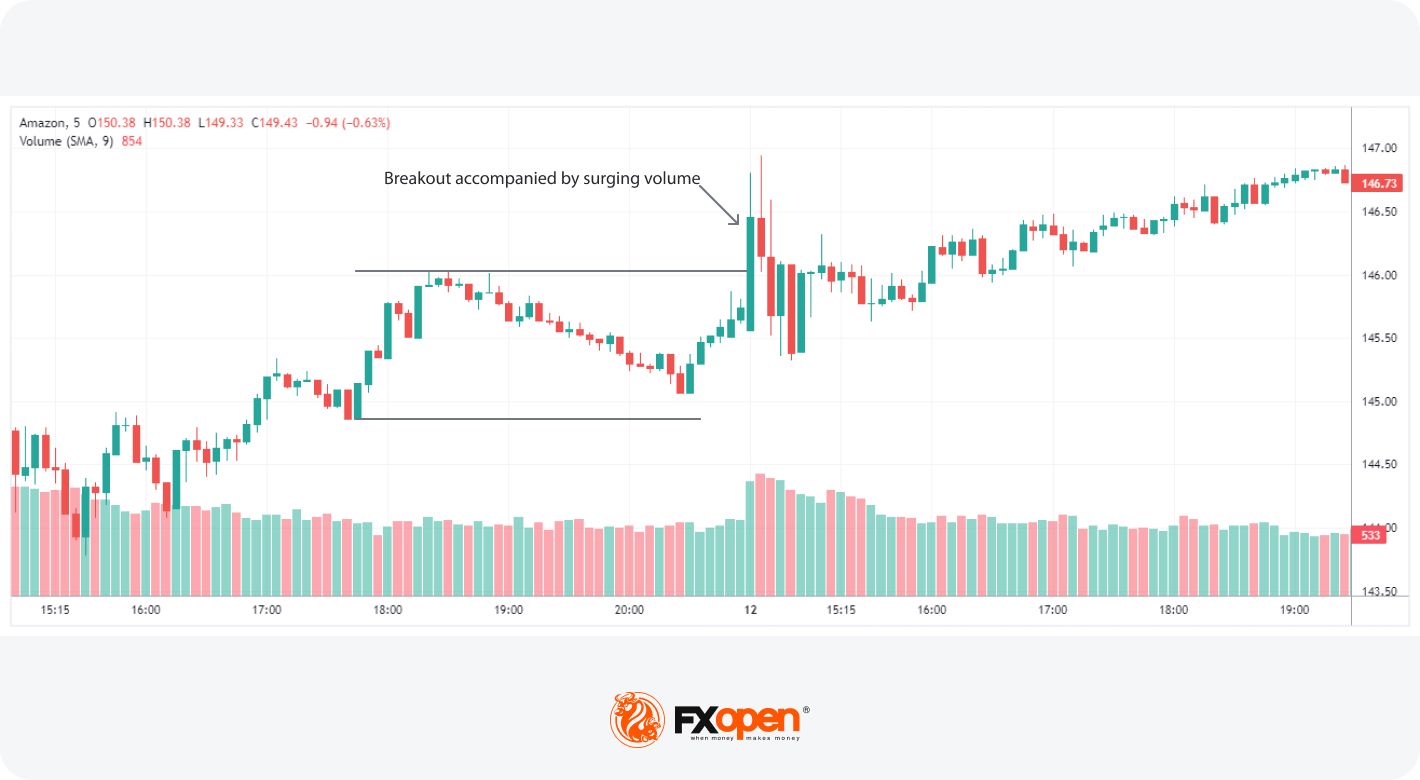
One key signal is the volume spike. A sudden increase in trading activity, especially when it deviates notably from the norm, may indicate a significant event or sentiment change. For instance, a volume spike accompanying a breakout from a consolidation pattern might confirm the strength of a new trend, offering a buying opportunity for traders.
Conversely, an unexpected, sustained drop in interest during a steady trend might be a warning sign. This could suggest that the current trend is losing momentum and might be nearing its end, reflecting a potential exit point or even a reversal opportunity.
Another aspect to consider is the trend over time. Gradually increasing volume in a trending market reinforces the trend's validity and vice versa.
Overall, trading volume isn't just about high or low numbers. It's about understanding the context of these changes and how they align with price movements.
Volume Indicators and Tools
When exploring how to use volume in trading, several key indicators and tools stand out. These provide insights into market dynamics, aiding in decision-making:
- On Balance Volume (OBV): OBV totals volume during up periods and subtracts it during down periods. A rising OBV usually suggests bullish trends, while a falling OBV indicates bearish trends. It's used to confirm movements or spot divergences.
- Volume Price Trend (VPT): VPT combines volume and price change to assess the strength of price moves. An increasing VPT usually indicates strong buying pressure, while a decreasing VPT suggests selling pressure.
- Accumulation/Distribution Line: This indicator considers the trading range and the volume. It helps identify whether a stock is being accumulated (bought) or distributed (sold). A rising line usually suggests accumulation, while a falling line indicates distribution.
- Chaikin Money Flow (CMF): CMF combines price and volume to measure buying and selling pressure over a set period. A positive CMF usually demonstrates buying interest, while a negative CMF suggests that sellers are in charge.
Volume as an Indicator of Liquidity
Lastly, volume is a key indicator of liquidity in the stock market. High trading activity reflects that a significant number of shares are being bought and sold, which typically indicates good liquidity. This liquidity may help traders execute trades quickly and at prices close to the market rates, reducing the cost of transactions.
Conversely, low volume signals poor liquidity, where fewer shares are traded. In such scenarios, executing large orders may be challenging without significantly impacting the stock. Such a lack of liquidity can lead to larger bid-ask spreads and potentially less favourable execution prices for traders.
The Bottom Line
As we've journeyed through the intricate world of stock volume, it's clear that understanding volume is more than a skill – it's an essential aspect of savvy trading. From recognising sentiment to navigating various market conditions, volume serves as a powerful tool in your trading arsenal.
To put this knowledge into practice and experience the dynamic world of trading, consider opening an FXOpen account. Once you do, you'll have the opportunity to apply these insights in real-time, potentially enhancing your trading journey with informed decisions driven by volume analysis. Happy trading!
This article represents the opinion of the Companies operating under the FXOpen brand only. It is not to be construed as an offer, solicitation, or recommendation with respect to products and services provided by the Companies operating under the FXOpen brand, nor is it to be considered financial advice.
Stay ahead of the market!
Subscribe now to our mailing list and receive the latest market news and insights delivered directly to your inbox.


Latest articles

US Dollar Index Analysis: Dollar at a Crucial Point, What's Next?
As the chart shows, the US Dollar Index (DXY) has gained more than 4% from its January lows, with the move accelerating from February 2026 onwards. Today, the dollar finds itself at a technically and fundamentally critical point, one that

US Natural Gas: Inventory Surplus Continues to Weigh on Prices
The US natural gas market (XNG/USD) is entering the summer season under the influence of two opposing forces. Domestically, the picture remains bearish. According to the EIA, working gas in underground storage stood at 2,688 billion cubic feet
Forex Kill Zone Times and ICT Trading Sessions
Kill Zone trading is a