


FXOpen
In the forex trading journey, the Ichimoku indicator serves as a beacon, guiding through the fog of market uncertainty. This article delves into the intricacies of the Ichimoku Cloud, unveiling strategies that harness its full potential. From the traditional Japanese techniques to the contemporary twists, equip yourself with the knowledge to navigate the currency tides adeptly.
Ichimoku Indicator: A Brief Overview
The Ichimoku Cloud indicator, a comprehensive technical analysis tool, originated in Japan and has since gained global traction among traders for its ability to offer a panoramic view of market sentiment and potential price movements. At its core, the Ichimoku is composed of five lines, each reflecting a specific price action aspect and timeframe.
The Tenkan-sen, or Conversion Line, reflects the mean of the highest high and the lowest low over the last nine periods, offering a quick glimpse of price momentum. In contrast, the Kijun-sen, or Base Line, calculates the same over the last 26 periods, providing a more moderate pace of market trend.
The Senkou Span A and Senkou Span B, forming the "Cloud" or Kumo, project 26 periods ahead, delineating support and resistance zones and forecasting potential price action. Lastly, the Chikou Span, or Lagging Span, plots the current closing price 26 periods behind, juxtaposing present price action against past performance to discern trends.
For those seeking the best Ichimoku settings, the default parameters of 9,26,52 are widely regarded as the most effective, though some traders customise them to suit their trading style. As for the best time frame for Ichimoku usage, there is no single best time frame. Many traders use the higher timeframe charts to guide their interpretation, however.
To gain the best understanding of how the three strategies below work, consider following along in FXOpen’s free TickTrader platform. There, you’ll be able to get started with the Ichimoku indicator in minutes.
TK-Cross Above/Below Kumo
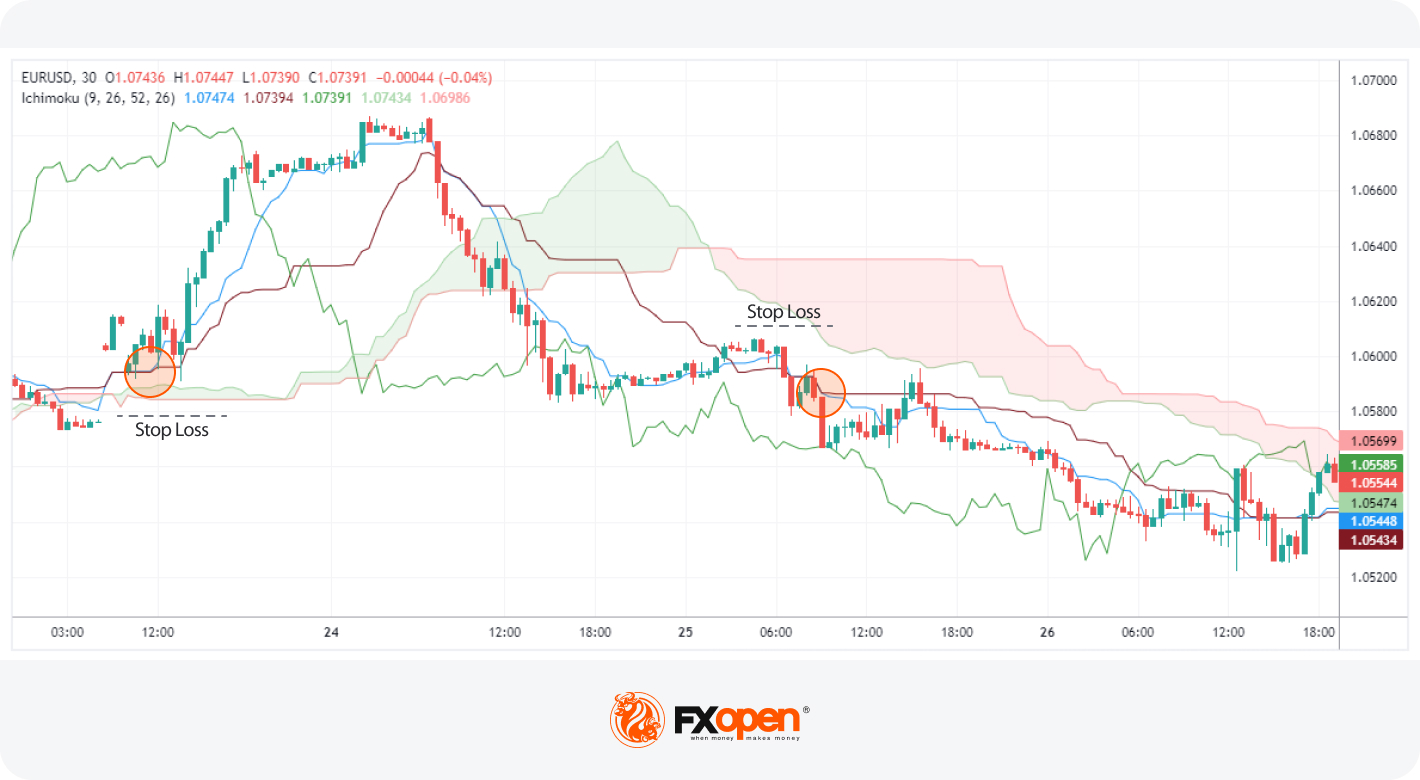
Those keen on Ichimoku trading strategies often observe the Tenkan-sen and Kijun-sen for potential entry signals. A classic setup unfolds when the Tenkan-sen crosses the Kijun-sen. Specifically, a bullish signal is considered when this cross occurs above a green Kumo, indicating a strong uptrend, while a bearish signal is detected with a cross below a red Kumo, suggesting a downtrend.
Entry
Traders may consider a position when the Tenkan-sen crosses over the Kijun-sen.
A bullish entry is typically sought above a green Kumo, whereas a bearish entry is pursued below a red Kumo.
Stop Loss
Stop losses can be placed beyond the opposite side of the Kumo for a broader risk management approach. Alternatively, traders might set a stop loss beyond a nearby swing high or low for a tighter stop.
Take Profit
Profits are often taken upon an opposing Tenkan-sen and Kijun-sen crossover, signalling a potential shift in momentum. Another strategy is to exit at key support or resistance levels, depending on the initial trade direction.
This Ichimoku trading system leverages the indicator's ability to integrate multiple trend signals. The Tenkan-sen and Kijun-sen crossing above or below the Kumo reflects a confluence of momentum and trend confirmation. Traders value this cross as it combines immediate price action with longer-term market bias, making it ideal for Ichimoku day trading.
Kumo Twist with Momentum
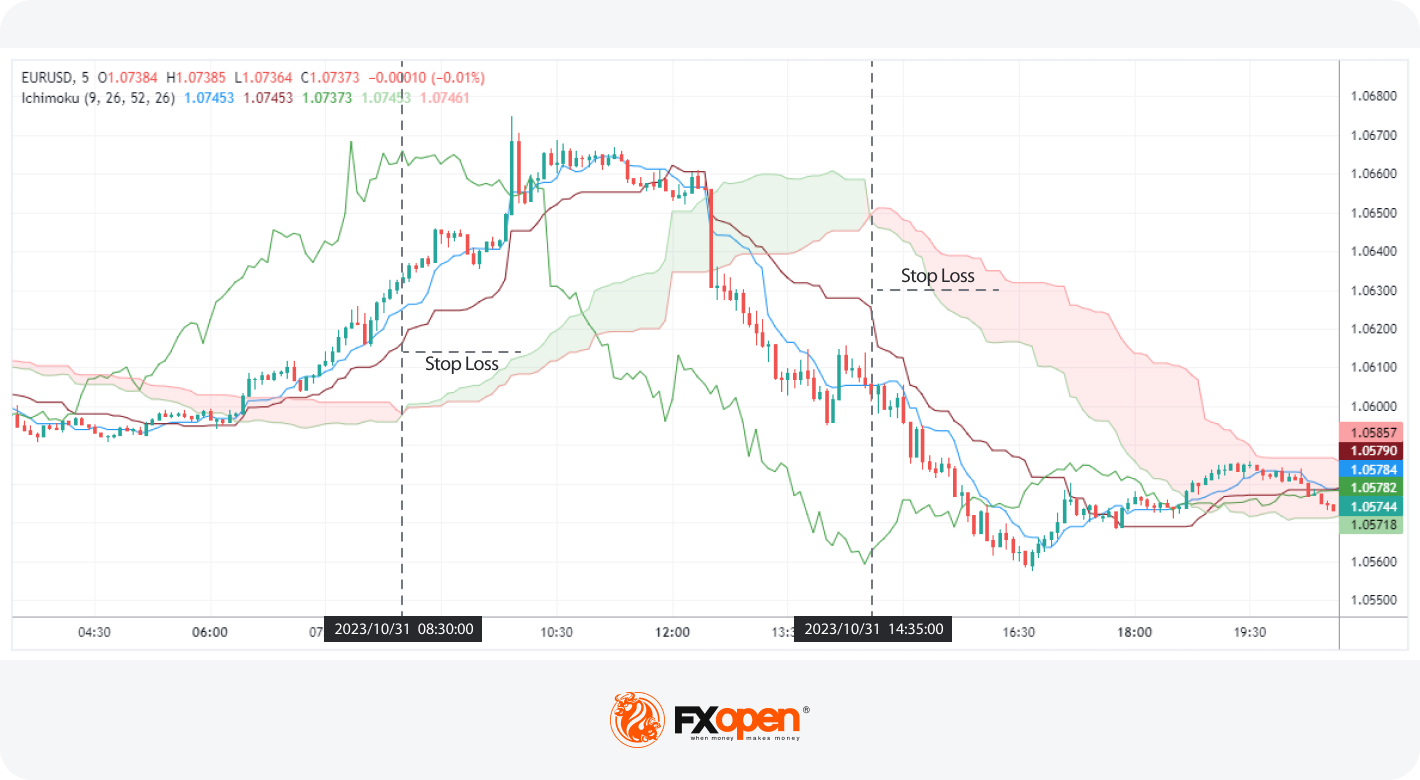
A Kumo twist refers to the scenario where the Ichimoku Cloud transitions from red to green (bullish) or green to red (bearish), which many traders interpret as a shift in market sentiment. The strategy gains relevance when the price is distant from the Cloud, implying strong momentum in the direction of the twist.
Entry
A viable entry point is recognised when a Kumo twist occurs while the price is markedly removed from the Cloud. Strong momentum away from the Kumo at the time of the colour change enhances the entry signal.
Stop Loss
Stop losses are commonly set beyond the far side of the Kumo or the Kijun-sen. A stop loss may also be positioned at a nearby swing high or low, offering a more precise risk limitation.
Take Profit
Taking profits at key support or resistance levels is a frequent practice, capitalising on significant price barriers. An alternative profit-taking signal occurs with a Tenkan-sen and Kijun-sen crossover, indicating a potential reversal or loss of momentum.
The Kumo Twist with Momentum strategy identifies shifts in market equilibrium that are supported by strong price movements. This approach is appreciated for its integration of visual trend changes with the Cloud's predictive qualities, serving as a gauge for market direction while utilising momentum as a confirmation of strength in the prevailing trend.
Kumo Breakout with Engulfing Candle
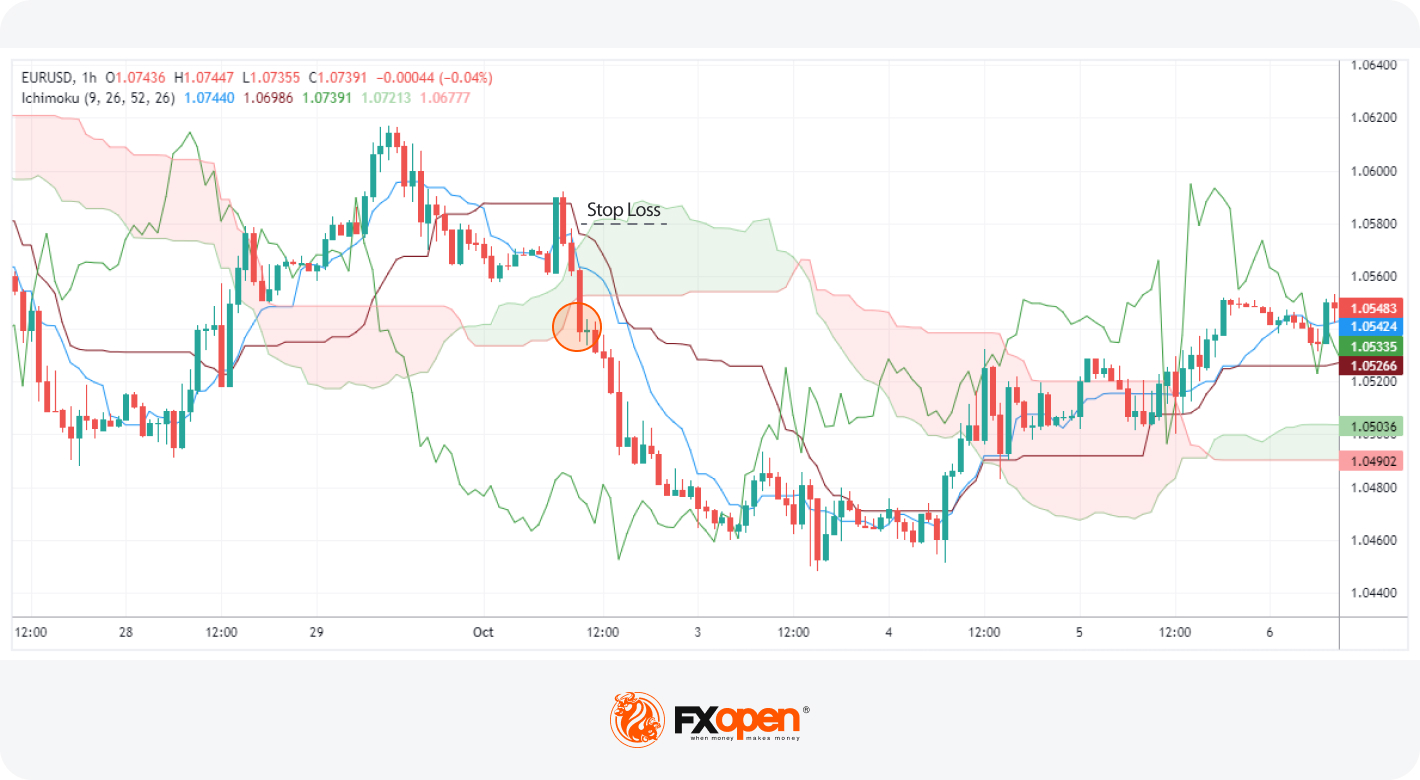
The Kumo breakout strategy becomes particularly potent when accompanied by an engulfing candle—a top secret about Ichimoku that seasoned traders exploit. This setup is believed to signal the commencement of a new trend.
Entry
The entry point is identified when strong price action breaks through the Kumo, coupled with an engulfing candlestick pattern. Traders may opt to take a position as the engulfing candle closes, confirming the breakout.
Stop Loss
A stop loss can be strategically placed beyond the Kijun-sen or Kumo cloud to align with the Ichimoku's medium-term view. Alternatively, setting a stop loss beyond a nearby swing high or low may offer a more refined risk management parameter.
Take Profit
Profits are often secured at a critical support or resistance level, leveraging these pivotal price points. Taking profits can be further optimised by monitoring price action for signs of exhaustion or reversal.
The rationale behind the Kumo Breakout with an Engulfing Candle rests on the pattern’s implication of a strong shift in market sentiment and the likelihood of trend continuation. This strategy merges the predictive power of the Ichimoku Cloud with classic candlestick analysis to discern substantial moves, favouring traders who capitalise on the early stages of trend formation.
The Bottom Line
In summary, the Ichimoku indicator offers traders a unique lens to view market dynamics. By understanding and applying strategies like the TK-Cross, Kumo Twist, and Breakout with an Engulfing Candle, traders can better navigate the forex market's complexities. For those eager to put these methods into practice, opening an FXOpen account could be the gateway to applying the Ichimoku strategies in real-world trading scenarios.
This article represents the opinion of the Companies operating under the FXOpen brand only. It is not to be construed as an offer, solicitation, or recommendation with respect to products and services provided by the Companies operating under the FXOpen brand, nor is it to be considered financial advice.
Stay ahead of the market!
Subscribe now to our mailing list and receive the latest market news and insights delivered directly to your inbox.


Latest articles

USD/CAD Rises to a Two-Month High
Today, the USD/CAD currency pair climbed above the 1.3787 level for the first time since late January.
→ Demand for the US dollar is being supported by concerns over escalating tensions in the Middle East. Market participants are favouring

Alphabet (GOOGL) Shares Fall to 2026 Low
As the chart shows, Alphabet (GOOGL) shares have dropped to their lowest level of 2026, with trading closing well below the psychological $300 per share mark.
Why Have Alphabet (GOOGL) Shares Declined?
The bearish move is driven by a combination

FX Market Awaits Macro Data: EUR/USD and GBP/USD Near Range Boundaries
European currencies are trading without a clear direction against the US dollar, remaining in a consolidation phase following the earlier decline driven by USD strength. At the start of the week, both EUR/USD and GBP/USD attempted a recovery,