


Litecoin and EOS - higher degree downtrend confirmed
FXOpen

LTC/USD
From last week’s high when the price of Litecoin has been sitting around $75.642 on Friday, we have seen a decrease of 14.48% measured to the lowest point the price has been today which is at $64.7. The price is currently being traded slightly higher but is retesting the low level’s vicinity.
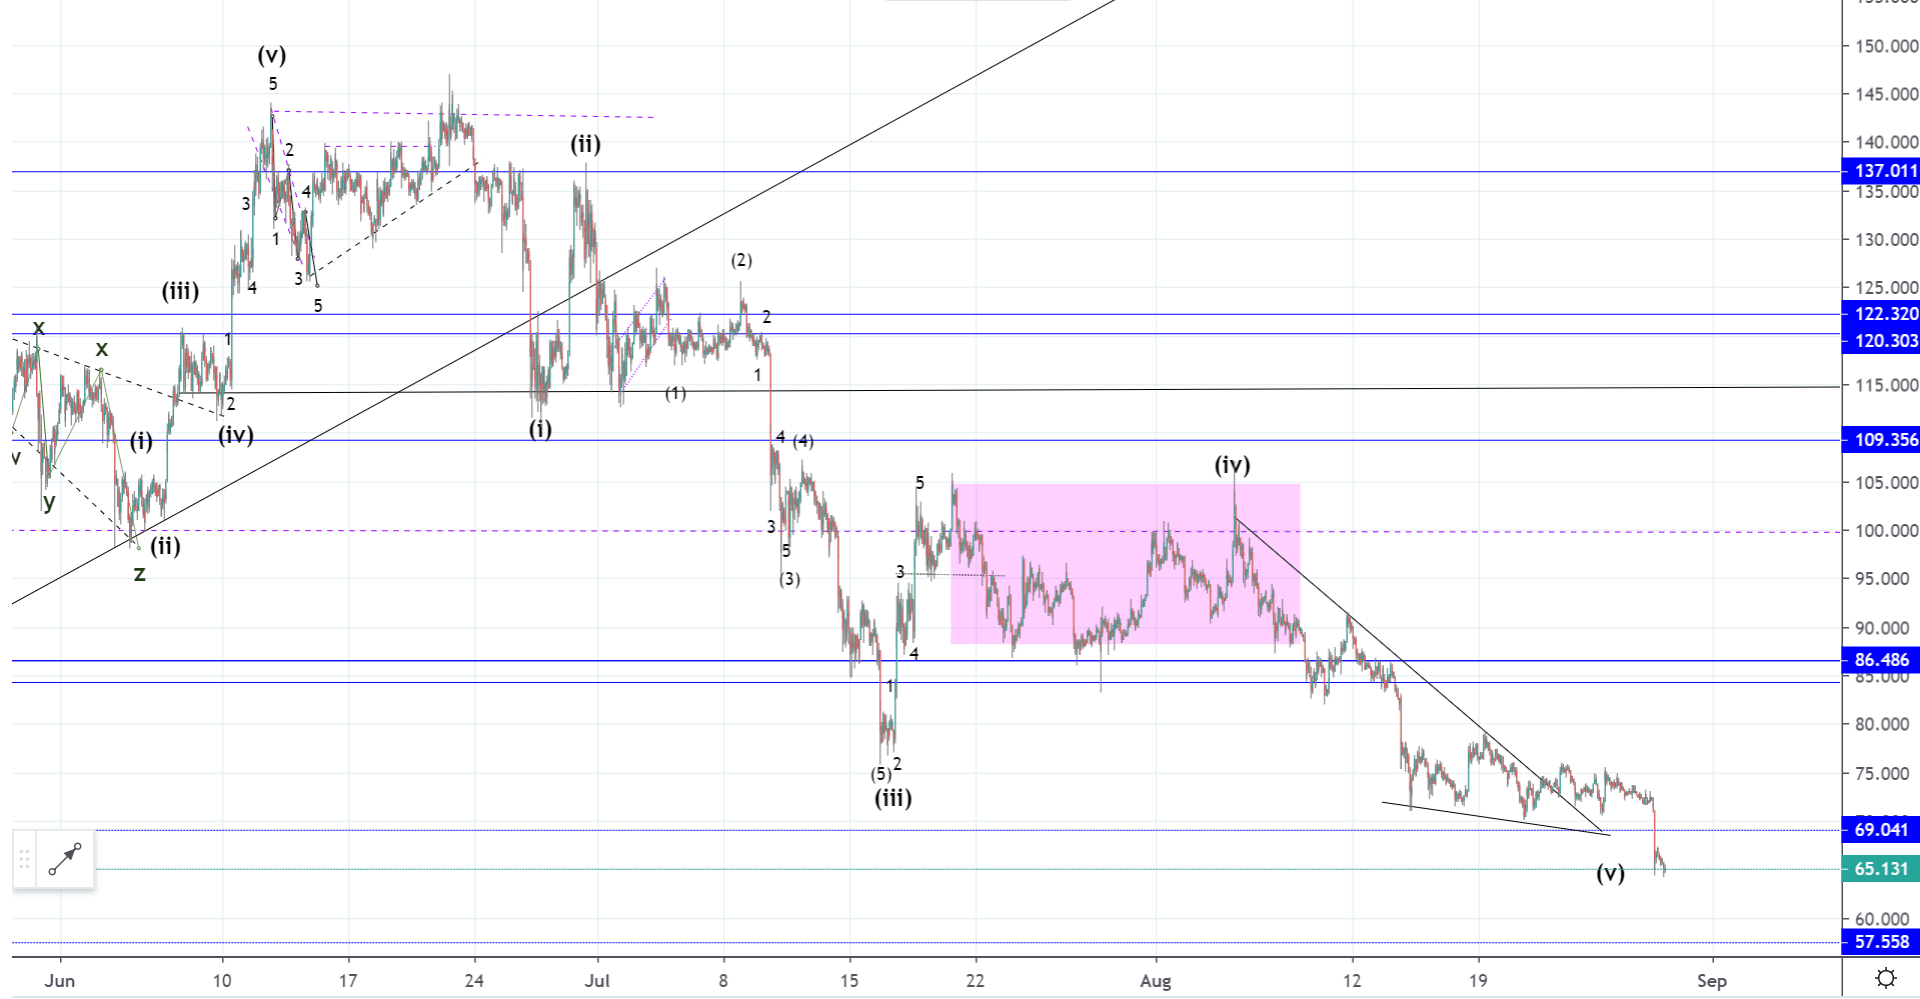 As you can see from the hourly chart the price went on to break out from the descending triangle on the upside but since it failed to exceed the prior high and instead made a lower one we have seen a downfall below the significant horizontal level at $69.
The wave structure is pointing out that we are seeing the 5th wave out of the five-wave move from the yearly high especially considering that a lower low has been made compared to the labeled 3rd wave which ended around $78.
The decrease is likely to continue as the 5th wave should develop fully and end on some of the lower horizontal support levels out of which the first one is at $62.6 and the next one is at $57.558.
As we are seeing the development of the last wave a recovery is soon to being but as the decrease was made in a five-wave manner the expected recovery would likely be corrective in nature and would develop in a three-wave manner.
This means that we are seeing the higher degree downtrend developing with the price of Litecoin likely headed towards the lower support area before the downtrend ends.
EOS/USD
Last Friday, the price of EOS has reached $3.7589 at its highest point which was the horizontal resistance point from the 18th of August. As the interaction ended as a rejection we have seen the sellers pressure pushing the price sharply to the downside falling down to $3.112 at its lowest point yesterday which is a decrease of 17.2% from last week’s high.
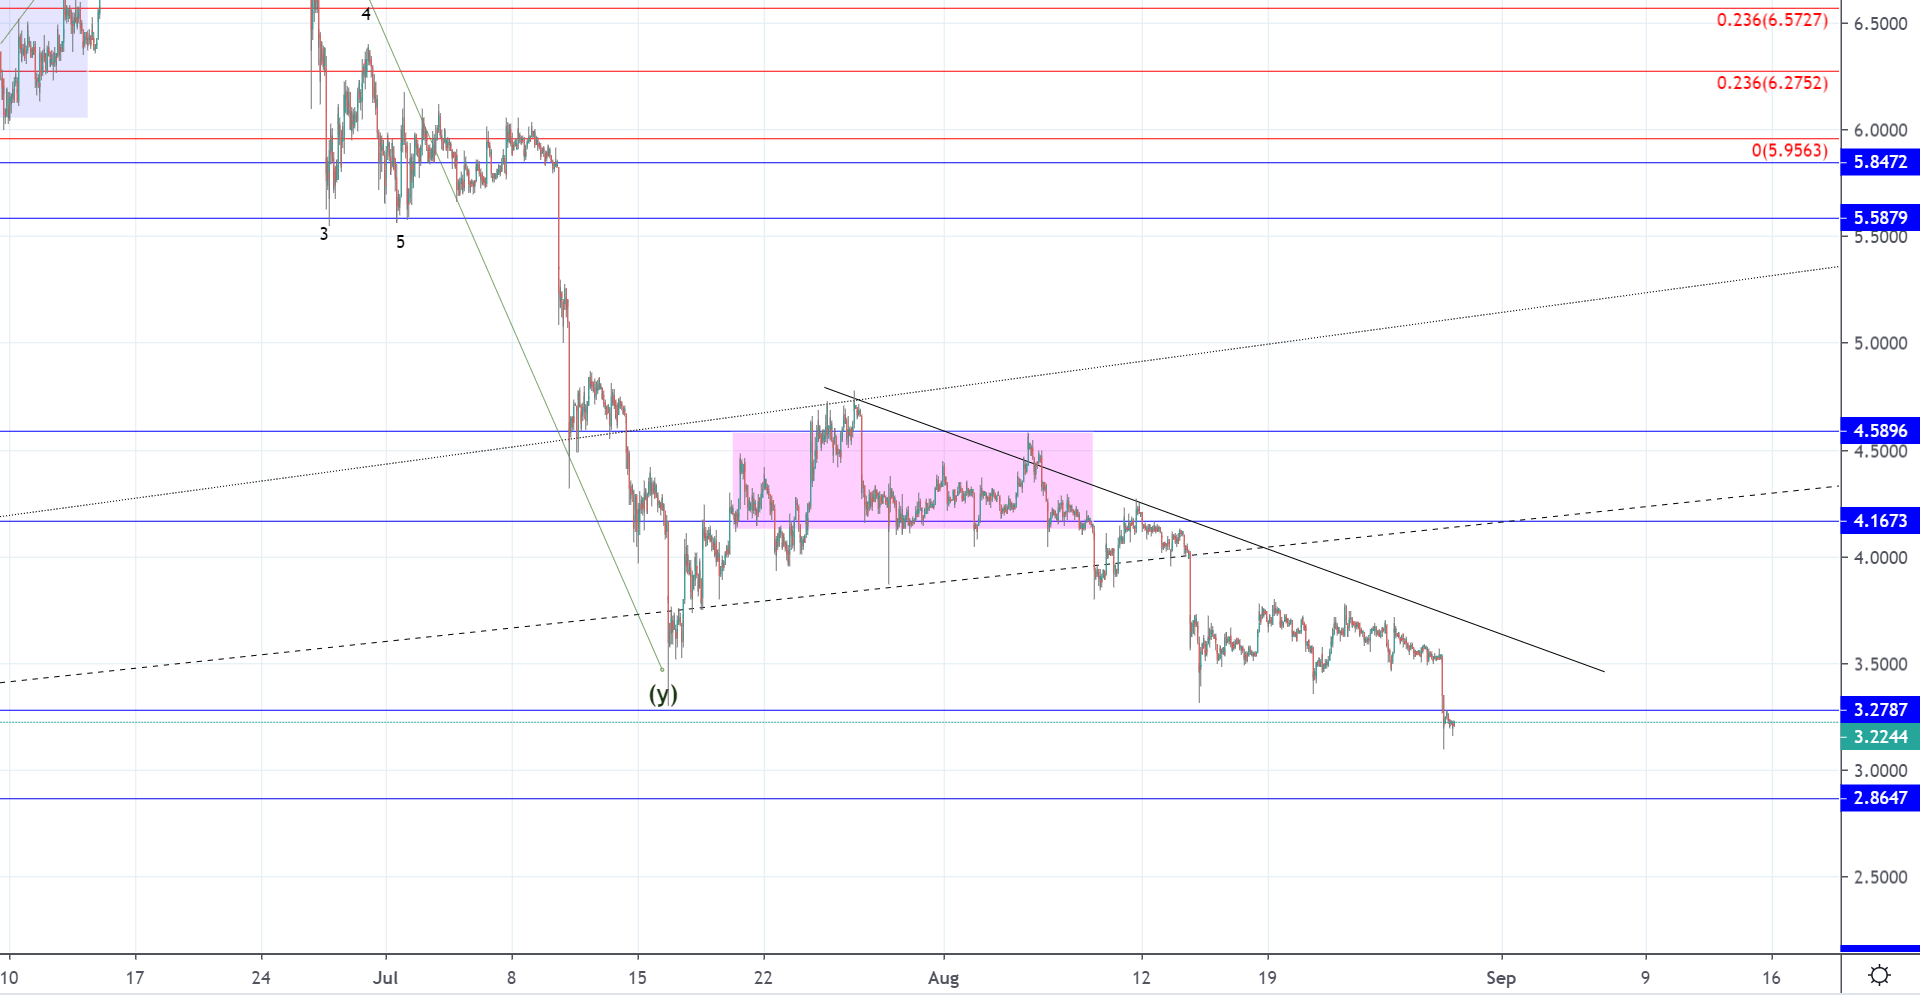 Looking at the hourly chart, you can see that the price came down below the horizontal support level at $3.2787 which has been retested from the downside and has rejected the price confirming that a breakout has occurred.
Like in the case of Litecoin the price has decreased in a five-wave manner from its yearly high which means that we are seeing the higher degree downtrend developing but as the price action is currently developing its ending wave the decrease is likely to end soon as the corrective recovery should begin.
Before the recovery, the price has to establish some firm support and the most optimal price target for the end of the decrease could be at the next horizontal level in line to the downside which is at $2.8647 but I spike to the downside below it entering the lower range could occur which would then be seen as a wick on the higher time frame.
FXOpen offers the world's most popular cryptocurrency CFDs*, including Bitcoin and Ethereum. Floating spreads, 1:2 leverage — at your service (additional fees may apply). Open your trading account now or learn more about crypto CFD trading with FXOpen.
*Important: At FXOpen UK, Cryptocurrency trading via CFDs is only available to our Professional clients. They are not available for trading by Retail clients. To find out more information about how this may affect you, please get in touch with our team.
This article represents the opinion of the Companies operating under the FXOpen brand only. It is not to be construed as an offer, solicitation, or recommendation with respect to products and services provided by the Companies operating under the FXOpen brand, nor is it to be considered financial advice.
Stay ahead of the market!
Subscribe now to our mailing list and receive the latest market news and insights delivered directly to your inbox.


Latest articles

EUR/USD and GBP/USD consolidate ahead of the Fed decision
European currencies are showing subdued dynamics, entering a consolidation phase following their previous advance. Earlier, EUR/USD and GBP/USD broke out of their ranges and strengthened; however, the subsequent correction has led both pairs to retest the previously breached

Meta: V-Shaped Recovery Meets Heavy Volume Resistance
The movement in Meta Platforms shares is being driven by two competing narratives. On one hand, advertising revenue is benefiting from AI-based tools: the Advantage+ platform continues to support strong advertiser demand, and the analyst consensus for Q1 2026 revenue

Commodity Currencies Test Key Levels Ahead of Major Macro Data
Commodity-linked currencies are trading near key levels, showing restrained price action as market participants adopt a wait-and-see approach. The fundamental backdrop is shaped by expectations surrounding the release of Australia’s inflation data and the Bank of Canada’s interest