


LTC and EOS - Breakout expected
FXOpen

LTC/USD
Since Monday’s open at $40.22 the price of Litecoin has been increasing and reached it’s highest point on the next day which was at $47.22 and is an increase of 17.51%. Yesterday after a minor retracement the price came back to retest the weekly high and found resistance there but is now again being traded around those levels.
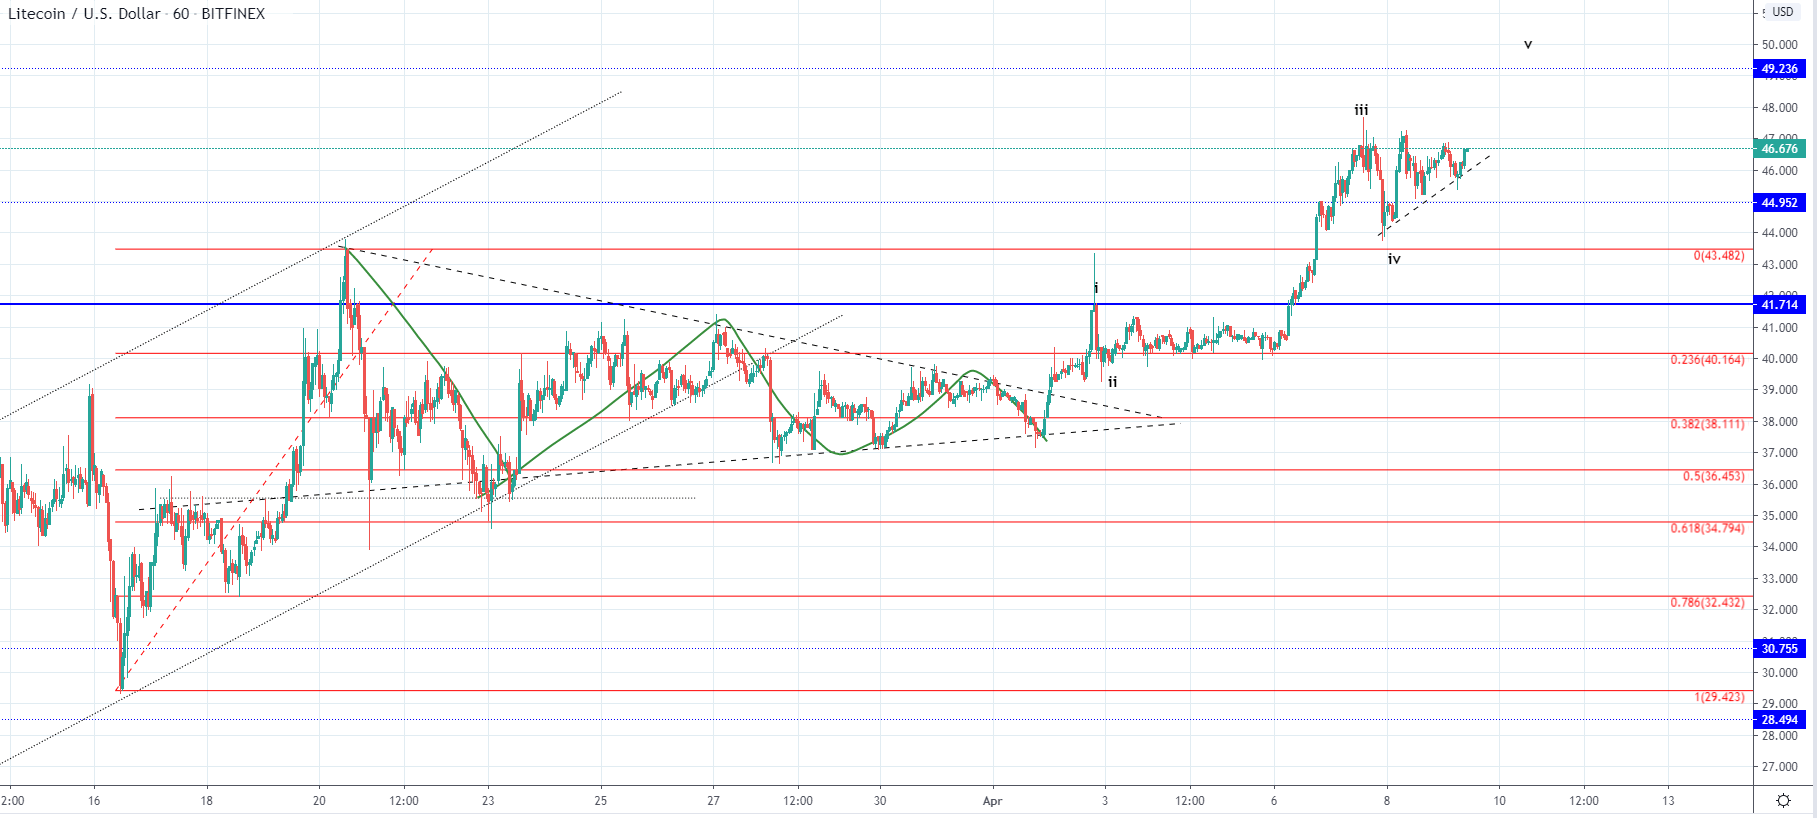 On the hourly chart, you can see that the price action made an ascending triangle with its support level being steep is indicating strong buyers pressure, but with the sellers defending the horizontal level. A breakout to the upside could be expected in which case the next horizontal level at $49.23 would be of significance but a more different outlook can be seen if the sellers are able to withhold the pressure.
If the price continues increasing and manages to breakout above the Tuesday’s high further increase would be expected in a spiky manner as the buyers chasing would push the price. But if the price encounters strong resistance after the current interaction it could bring the price in a straight downfall to the $41.7 horizontal level.
It all depends on whether or not we have seen the completion of the 5th wave from the impulsive move on Tuesday or are we to see one more wave to the upside.
EOS/USD
The price of EOS has increased by 19.43% coming from it’s open on Monday at $2.344 to $2.8 made on Tuesday. Like in the case of Litecoin the price action started forming an ascending triangle as it’s support level is steeper then it’s resistance one. 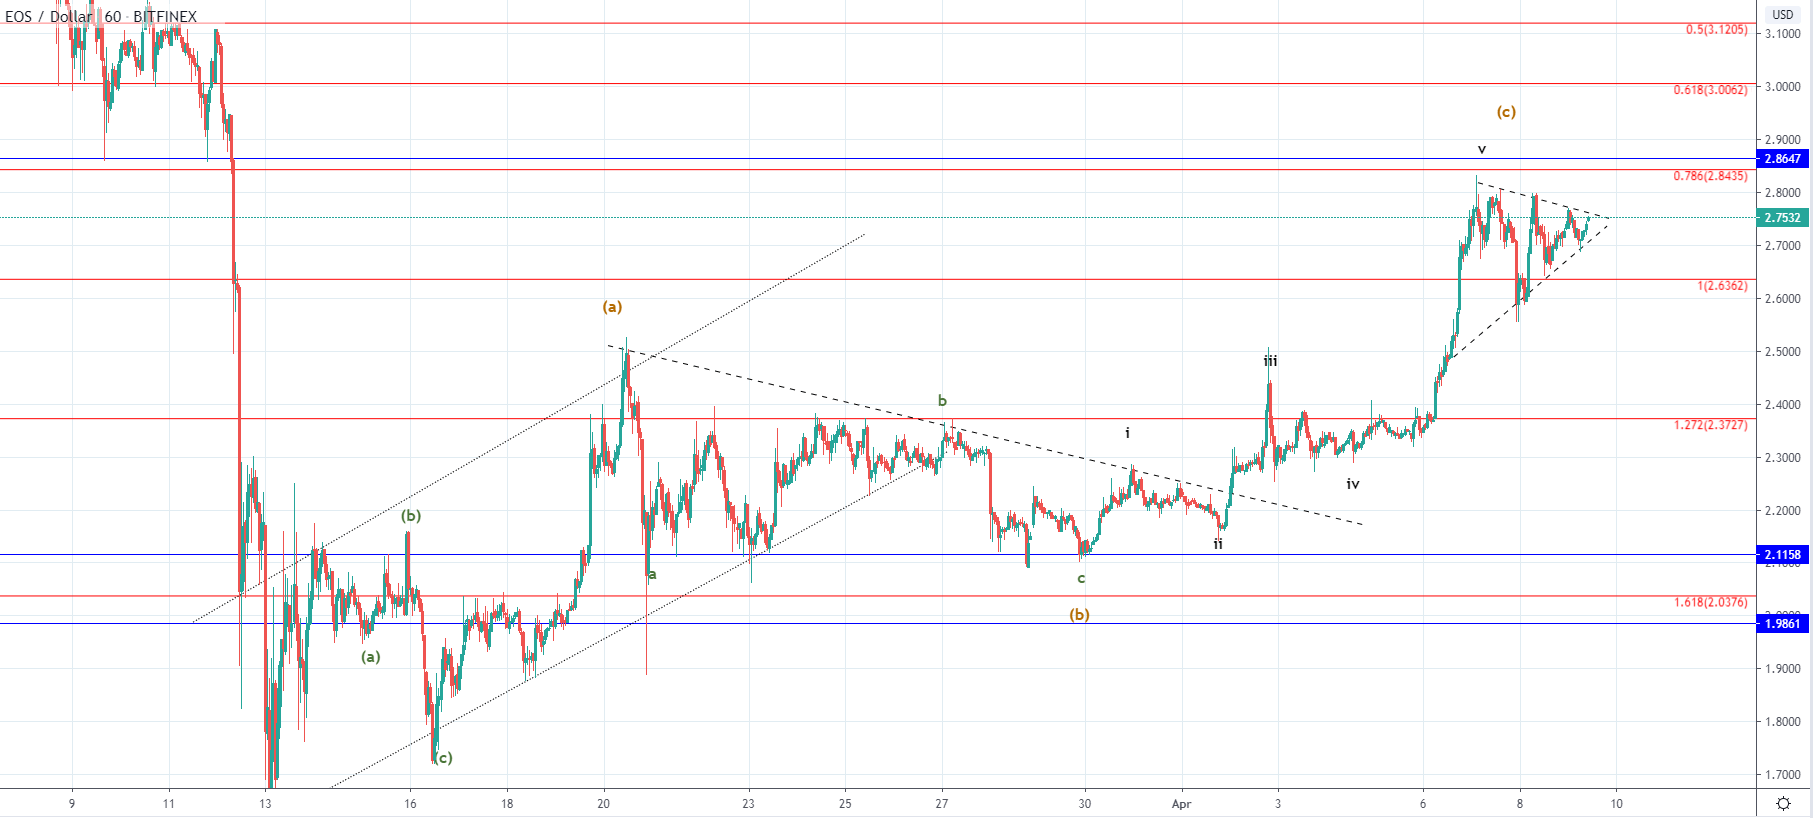
Looking at the hourly chart of EOS you can see that it outlines another possibility which was presented in the case of Litecoin, namely that the 5th wave out of the current impulse wave ended. Instead of the previous descending triangle forming a five-wave correction it made a three-wave one which is why the increase from the 30th of March and it’s first higher low could be the first two waves out of the five-wave impulse.
This will shortly be validated by the breakout direction from the ascending triangle but in either way, after it’s completion I would be expecting another corrective downward sequence. If the increase from mid-March until today was an ABC to the upside the descending move which is to follow could develop in another downtrend resulting in lower lows then in March.
FXOpen offers the world's most popular cryptocurrency CFDs*, including Bitcoin and Ethereum. Floating spreads, 1:2 leverage — at your service (additional fees may apply). Open your trading account now or learn more about crypto CFD trading with FXOpen.
*Important: At FXOpen UK, Cryptocurrency trading via CFDs is only available to our Professional clients. They are not available for trading by Retail clients. To find out more information about how this may affect you, please get in touch with our team.
This article represents the opinion of the Companies operating under the FXOpen brand only. It is not to be construed as an offer, solicitation, or recommendation with respect to products and services provided by the Companies operating under the FXOpen brand, nor is it to be considered financial advice.
Stay ahead of the market!
Subscribe now to our mailing list and receive the latest market news and insights delivered directly to your inbox.


Latest articles

Apple: Earnings Day Above the Activity Zone
On 30 April, after the market close, Apple Inc. will release its financial results for the second quarter of fiscal 2026. The consensus forecast, based on estimates from 31 analysts, points to revenue of around $109.7 billion, with expected

USD/JPY and USD/CHF Near Key Levels: The Dollar Supported by the Fed
The US dollar continues to trend upwards following the Federal Reserve meeting, drawing support from the regulator’s moderately hawkish stance and comments by Jerome Powell. Markets interpret the Fed’s rhetoric as a signal that restrictive policy is likely

EUR/USD and GBP/USD consolidate ahead of the Fed decision
European currencies are showing subdued dynamics, entering a consolidation phase following their previous advance. Earlier, EUR/USD and GBP/USD broke out of their ranges and strengthened; however, the subsequent correction has led both pairs to retest the previously breached