


LTC and EOS - Descending Triangles Near Completion
FXOpen
LTC/USD
From the 7th of November when the price of Litecoin has reached nearly $65 we have seen a decrease of 12% measured to its lowest point at $57.14 made on Tuesday. Since then the price has been increasing again but found failed to exceed the $60 level on three separate occasions. Now it is being traded at $58.419 after a third rejection at the $60 area.
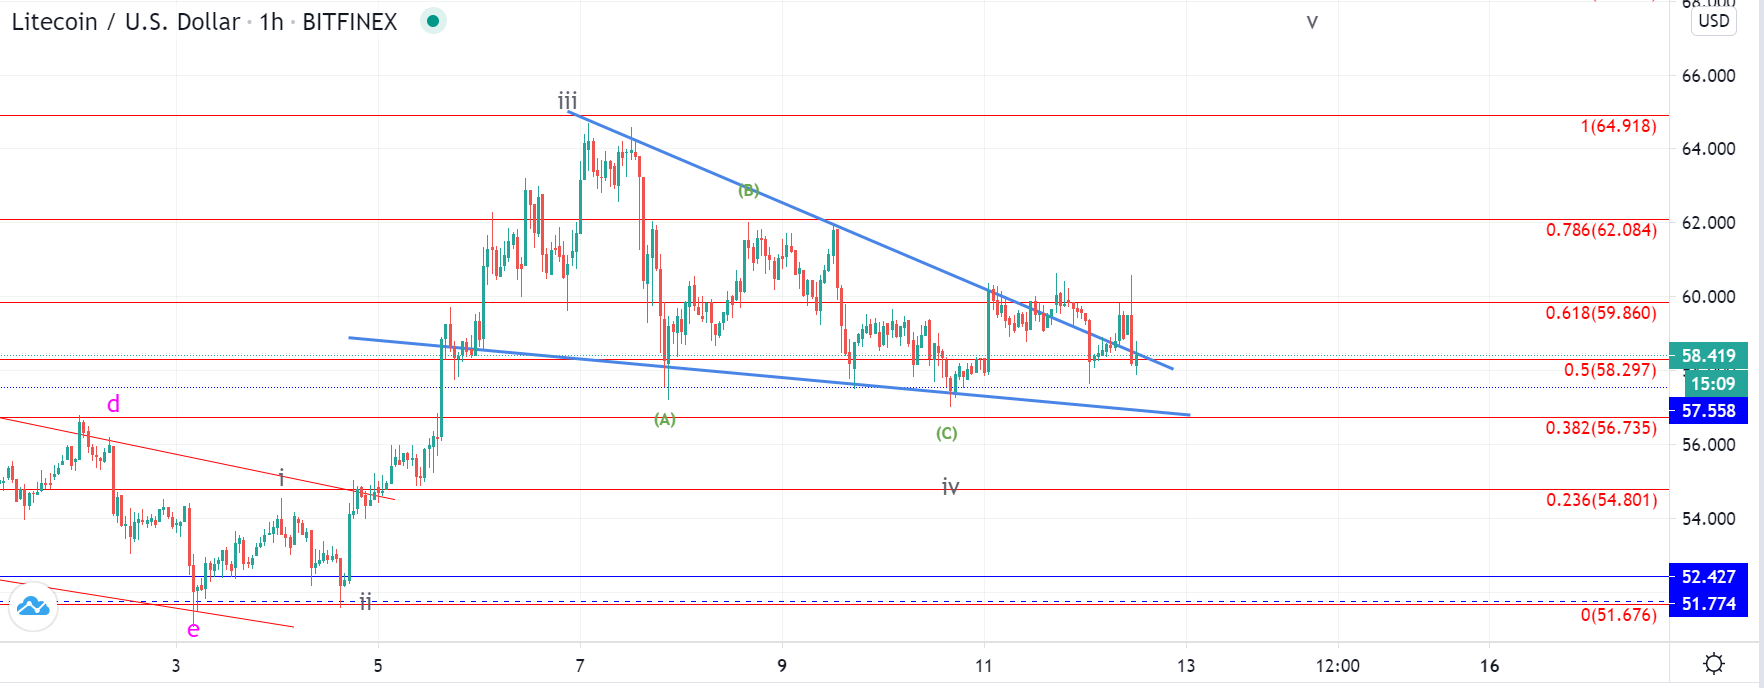
On the hourly chart, we can see that from last Saturday when the price made its previous high we have seen the formation of the descending triangle whos high interacted with the 1 Fib level which was a significant range from back on the 2nd of August this year. On the 16th of August, the price proceeded to increase to the next Fib level at $68.52.
As we have seen a recovery from Tuesday with the price making attempts to break out from the descending triangle and finding support on the 0.5 Fib level, making a higher low, it could indicate that the next impulsive move has started developing. This would be the 5th wave of a Minuette count as the ABC correction to the downside developed.
The price is currently testing the descending triangle’s resistance so we are yet to see if it finds support there, but if it does that could be an early sign that the uptrend is continuing to develop.
EOS/USD
The price of EOS has been showing a similar pattern as it made a descending triangle from the 7th of November when it reached $2.61 at its highest and fell down to $2.459. Unlike in the case of Litecoin, the price of EOS hasn’t made a breakout from the descending triangle and is instead being traded around its support level at the moment.
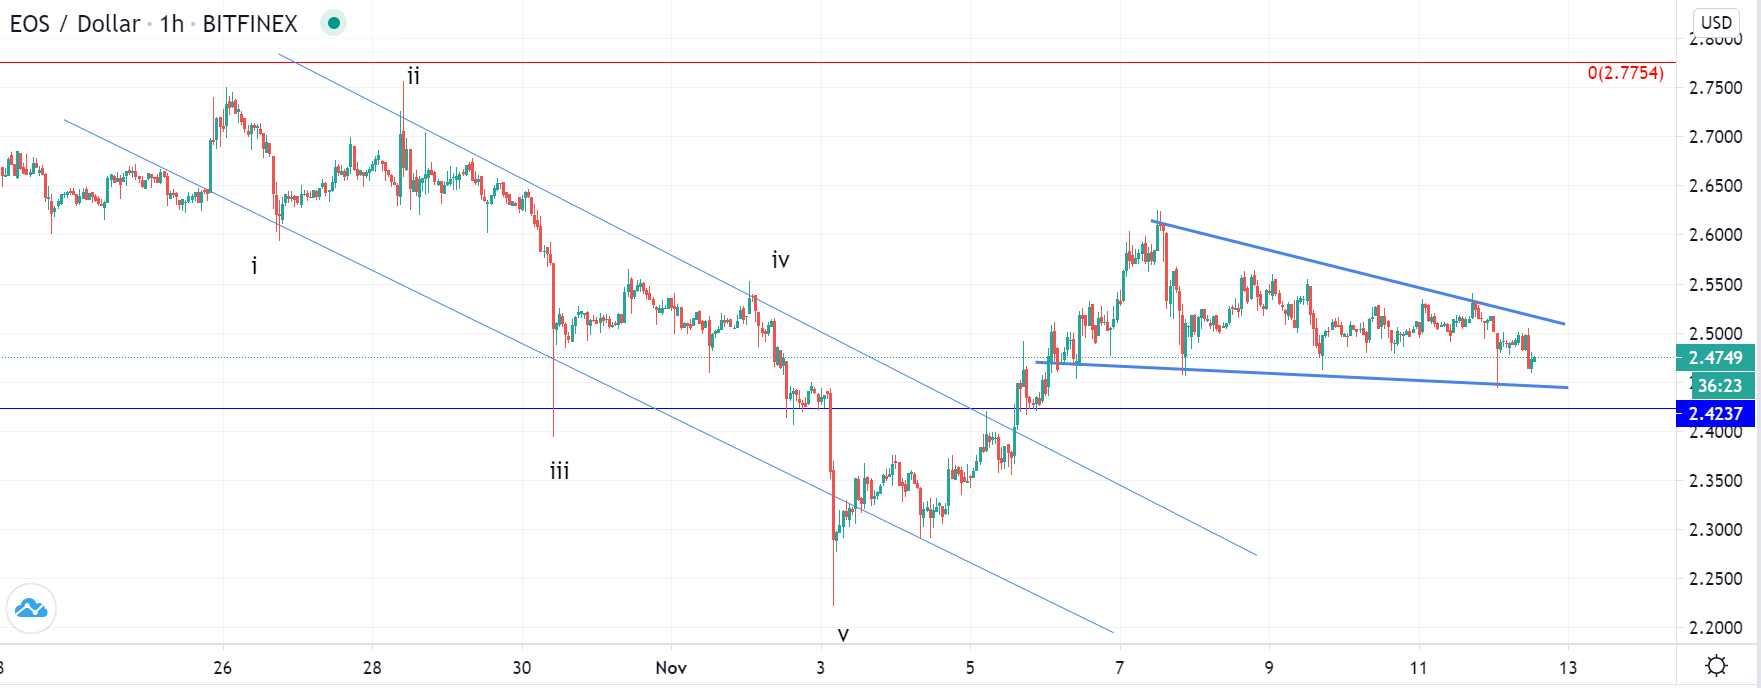
Looking at the hourly chart, you can see that the price broke out from the previous descending range in which a five-wave decrease was made. After the spike to the downside was made below the $2.25 we have seen the first minor move with the higher low at $2.3. Now we have seen another descending range after a runup which could be another significant consolidation range before the further increase is made.
This is why after the completion of the current descending triangle further upside would be expected to develop in which case it would be the 5th wave from the next five-wave impulse wave. The target price of this 5th wave could be somewhere around the 0 Fib level at $2.775 for a retest of resistance.
FXOpen offers the world's most popular cryptocurrency CFDs*, including Bitcoin and Ethereum. Floating spreads, 1:2 leverage — at your service (additional fees may apply). Open your trading account now or learn more about crypto CFD trading with FXOpen.
*Important: At FXOpen UK, Cryptocurrency trading via CFDs is only available to our Professional clients. They are not available for trading by Retail clients. To find out more information about how this may affect you, please get in touch with our team.
This article represents the opinion of the Companies operating under the FXOpen brand only. It is not to be construed as an offer, solicitation, or recommendation with respect to products and services provided by the Companies operating under the FXOpen brand, nor is it to be considered financial advice.
Stay ahead of the market!
Subscribe now to our mailing list and receive the latest market news and insights delivered directly to your inbox.


Latest articles

US Dollar Strengthens Amid Equity Market Weakness and Hawkish Fed Rhetoric
The US dollar continues to hold firm near multi-year highs as sentiment across equity markets deteriorates and investors increasingly expect the Federal Reserve to maintain a restrictive monetary policy stance for longer. The US economy remains resilient, while inflation risks

Bitcoin: Corrective Channel Broken as Traders Turn More Active
Bitcoin has come under the influence of several factors simultaneously. The wave of selling at the beginning of June was linked to Strategy's first disclosed Bitcoin sale in several years, a prolonged series of outflows from spot ETFs, and a

DAX 40: consolidation amid technology sell-off
A wave of selling in the technology sector that emerged earlier this week has weighed on European equities. The trigger was investor concern over the profitability of large-scale debt-funded investments by major US tech companies in AI infrastructure. The Nasdaq