


LTC and EOS - Is Reversal Soon To Start?
FXOpen
LTC/USD
The price of Litecoin has been decreasing through the previous period and fell back to the levels of the prior low at $43.6 around which it is currently being traded. From last Thursday we have seen an increase which resulted in a lower high at $46.3 after which the price continued moving to the downside and formed a lower low. These price movements have formed a descending triangle whose apex points out at the next significant horizontal level below the 1.272 Fibonacci one.
 On the hourly chart, you can see that this triangle is most likely an ending diagonal from the impulse move to the downside made from the 10th of November when the price of Litecoin was sitting at $64.832. The mentioned high is considered the ending point of the B wave from a higher degree count and is why after the completion of the currently seen down move I would be expecting a trend reversal.
If we are seeing the ending diagonal the price of Litecoin is now likely to continue bouncing inside the triangle for two more times and potentially retesting the $41.714 horizontal support level before we can see a breakout to the upside. As this ABC is the third correctional structure from the yearly high it means that the Y wave of a higher degree might have marked the completion of this complex correction. But the correction might get prolonged by another X and Z wave leading the price of Litecoin ultimately to lower lows before the bullish period can start.
EOS/USD
From Sunday when the price of EOS was sitting at $2.776 at its highest point we have seen a decrease of 8% measured to today’s lowest point at $2.554. The price is currently being traded slightly above today’s low but is showing early signs of minor reversal developing.
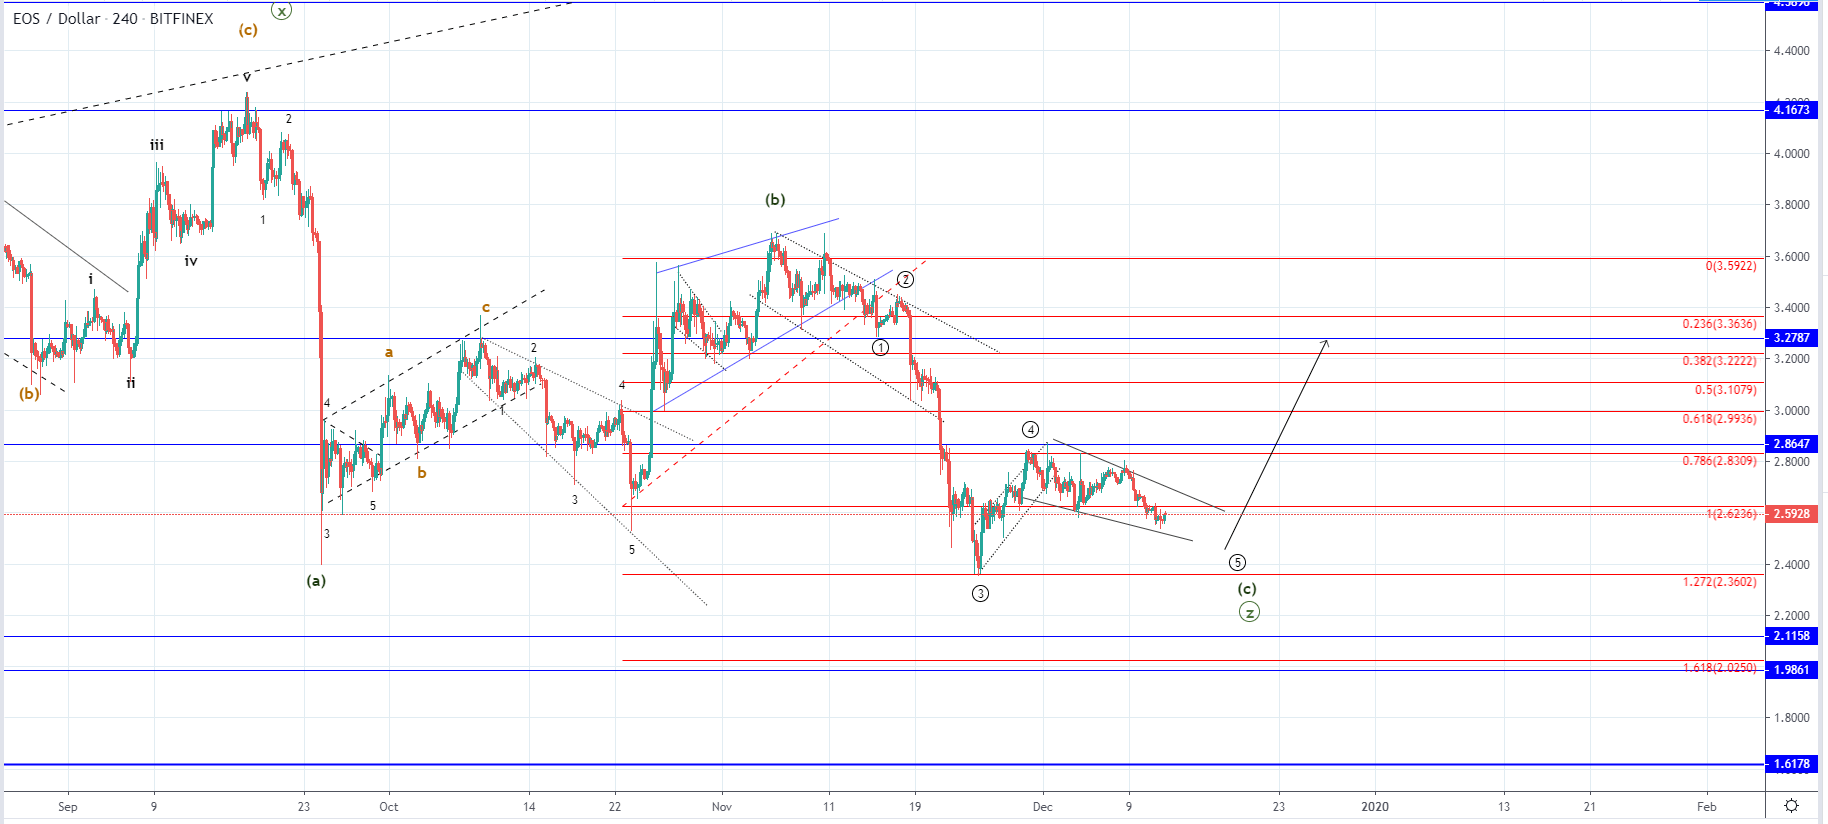 Looking at the hourly chart, we can see that the price of EOS hasn’t fallen back to the levels of the prior low like we have seen in the case o Litecoin but a similar pattern is developing as we have seen a descending triangle forming from the end of November. This means that a similar expectation is made although we might not see a retest of the prior low for the completion of the ending diagonal.
The lower retracement then in the case of Litecoin could imply that we are seeing yet another ABC move to the upside instead of the now presumed 4th and 5th wave. In that case, the 4th wave would be the A wave and the 5th would be the B wave in which case it must end as a three-wave move from which these possibilities will be validated.
FXOpen offers the world's most popular cryptocurrency CFDs*, including Bitcoin and Ethereum. Floating spreads, 1:2 leverage — at your service (additional fees may apply). Open your trading account now or learn more about crypto CFD trading with FXOpen.
*Important: At FXOpen UK, Cryptocurrency trading via CFDs is only available to our Professional clients. They are not available for trading by Retail clients. To find out more information about how this may affect you, please get in touch with our team.
This article represents the opinion of the Companies operating under the FXOpen brand only. It is not to be construed as an offer, solicitation, or recommendation with respect to products and services provided by the Companies operating under the FXOpen brand, nor is it to be considered financial advice.
Stay ahead of the market!
Subscribe now to our mailing list and receive the latest market news and insights delivered directly to your inbox.


Latest articles

US Dollar Index: A Defining Week for the King of the Markets
The dollar heads into a pivotal week trading near 101.80, just off a 15-month high, with the Fed's July 29 meeting standing as the clear focal point. Markets currently price roughly a 65% chance of a hold, though renewed

NZD/USD: Inflation Surge Meets Strong US Dollar Pressure
On 21 July, Stats NZ reported an acceleration in inflation: the Consumer Price Index rose 1.5% in the second quarter, while the annual inflation rate climbed to 4.1%, its highest level in more than two years and slightly

Weekly Market Insights with Gary Thomson: The Week of Central Banks and Earnings
In this video, we’ll explore the key economic events and market trends, shaping the financial landscape. Get ready for insights into financial markets to help you navigate the week ahead. Let’s dive in!
In this episode of Market