


FXOpen

LTC/USD
Last week, on Wednesday, September 23rd, the price of Litecoin came down to revisit the September 21st low area and was coming to around $42.5. Since then we have seen the formation of the ascending channel in which the price has been bouncing and now again came to its resistance level for a higher high. At the moment it is being traded at $47.9 which is slightly below todays high but is showing strong bullish momentum as the majority of the increase occurred in two hours.
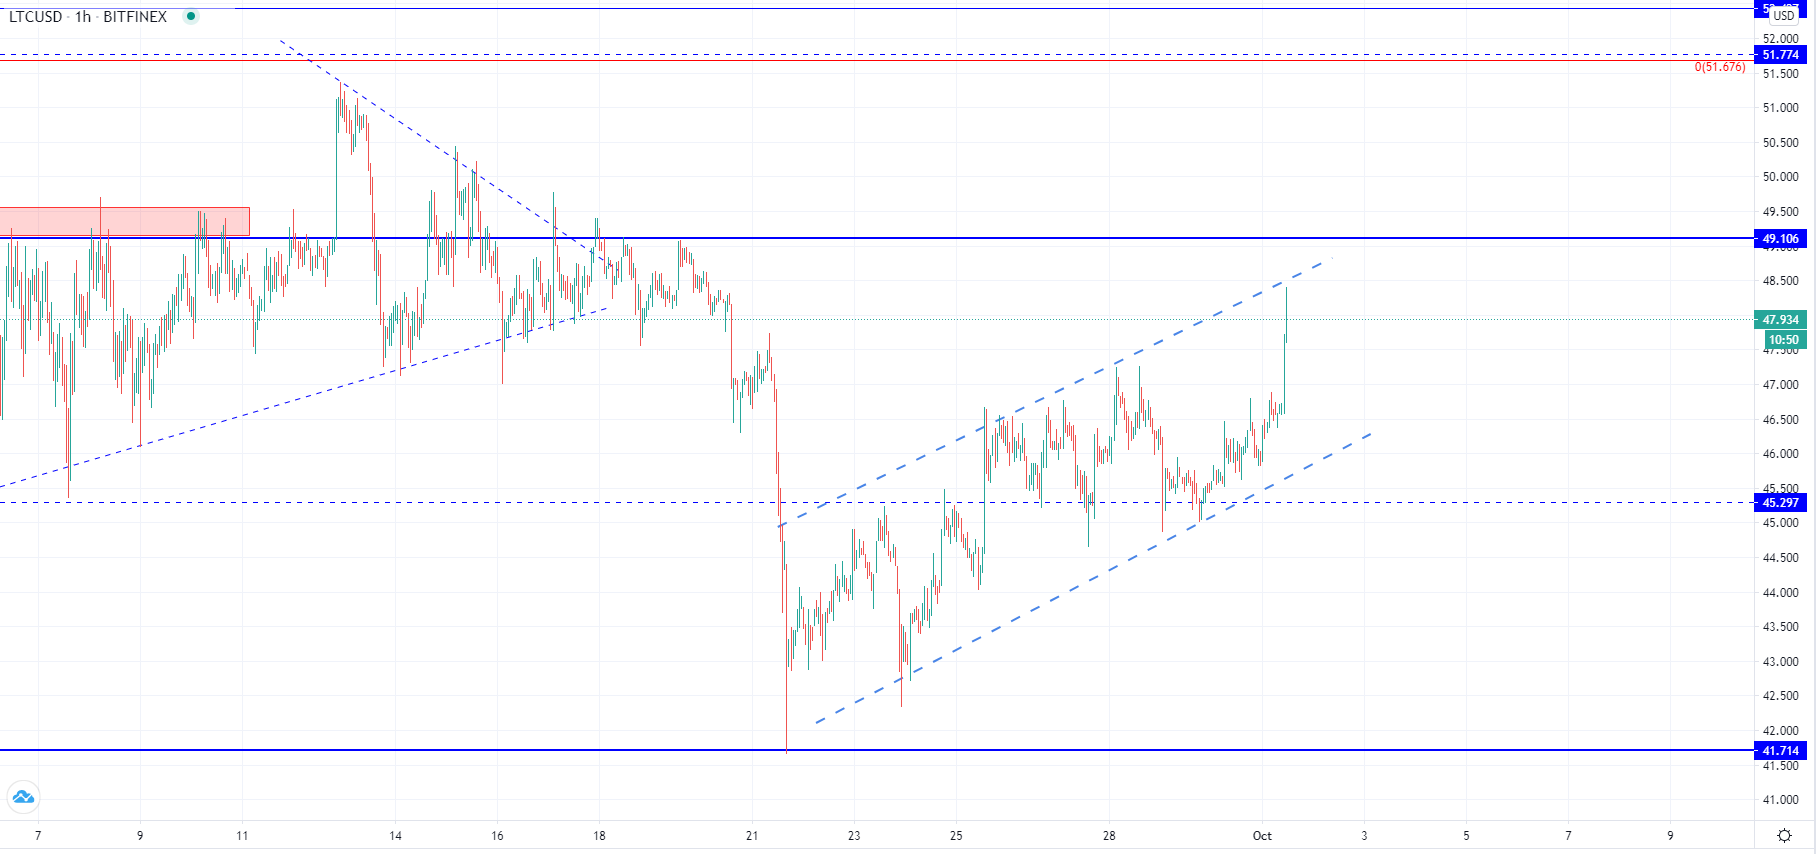
On the hourly chart, we can see that the price still hasn’t come to test the significant horizontal resistance point at around $49.1 but interaction is likely to occur shortly as it came above the minor horizontal level at around $47. A pullback might happen before the expected interaction in which case another retest of the ascending channels support level could be seen, but considering that the price has surpassed the $45.3 level it could find support around $46 area.
If the price starts moving to the downside again and starts going below the ascending channel’s support it can likely find it at the $45.3 level but if it continues moving below it, it would indicate that the channel structure was corrective in nature. However, more likely, we are to see an uptrend continuation and a breakout to the upside.
EOS/USD
The price of EOS has increased by 2.6% from yesterday’s low at $2.56 measured to its highest point today at $2.627 around which it is currently being traded.
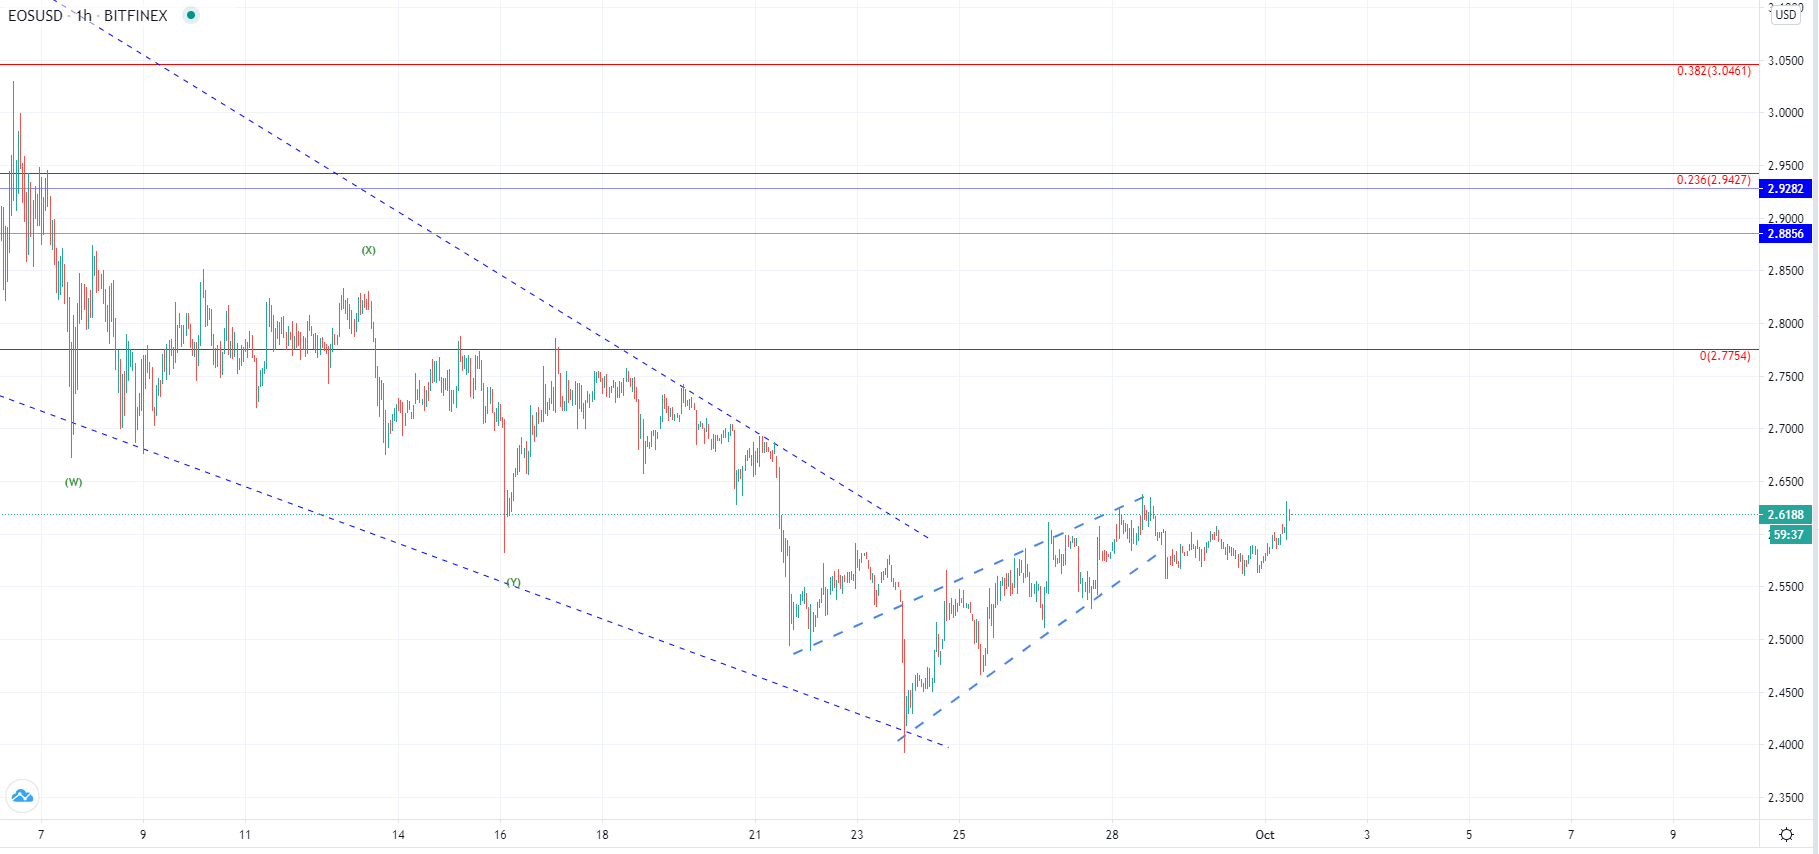
Looking at the hourly chart, you can see that a breakout was made from the descending triangle that was a dominant structure throughout most of September which could be interpreted as a bullish sign. The price increase from $2.39 on September 23rd to $2.635 level which was an increase of 10.12%. This high area is revisited today and we are yet to see if the price finds resistance there again like on Monday when the interaction with the area caused a minor pullback.
This minor pullback has made a horizontal support level above $2.56 which is an indication that the buyers are providing the support there, and with the ascending move that followed that the buying has been activated. Will this be enough to surpass the seller’s threshold we are yet to see, but if this ascending move is the continuation of the breakout momentum it is highly likely that the increase will continue.
The currently tested area is the previous horizontal support level validated on the 16th of September and now serves as resistance which is why its surpassing would indicate that the price increase is in a sustainable trend.
FXOpen offers the world's most popular cryptocurrency CFDs*, including Bitcoin and Ethereum. Floating spreads, 1:2 leverage — at your service. Open your trading account now or learn more about crypto CFD trading with FXOpen.
*At FXOpen UK and FXOpen AU, Cryptocurrency CFDs are only available for trading by those clients categorised as Professional clients under FCA Rules and Professional clients under ASIC Rules respectively. They are not available for trading by Retail clients.
This article represents the opinion of the Companies operating under the FXOpen brand only. It is not to be construed as an offer, solicitation, or recommendation with respect to products and services provided by the Companies operating under the FXOpen brand, nor is it to be considered financial advice.
Stay ahead of the market!
Subscribe now to our mailing list and receive the latest market news and insights delivered directly to your inbox.

Latest articles

Weekly Market Wrap With Gary Thomson: Nasdaq, EUR/USD, USD/CHF, Brent Crude Oil, Googl Shares
Get the latest scoop on the week's hottest headlines, all in one convenient video. Join Gary Thomson, the COO of FXOpen UK, as he breaks down the most significant news reports and shares his expert insights.
- Nasdaq Composite: Worst Session

Analysis of AUD/USD: Exchange Rate Falls to Early May Low
As indicated by the 4-hour AUD/USD chart today:
→ the rate fell below 0.652, a level last seen on May 2;
→ the RSI indicator dropped below 15, a level last seen during the panic over the spread of COVID-19

Analysis of AMZN Stock: Price at 1.5-Month Low
As shown in the AMZN chart, the stock price dropped below:
→ the psychological level of $180;
→ the mid-June interim low.
The last time AMZN traded below $180 was in early June.
Thus, AMZN has faced sell-offs, similar to other tech