


LTC/USD and EOS/USD in a bearish pennant
FXOpen
LTC/USD
From Monday’s spike at $62 the price of Litecoin has retraced by 11.8% as its currently trading at $54.73.
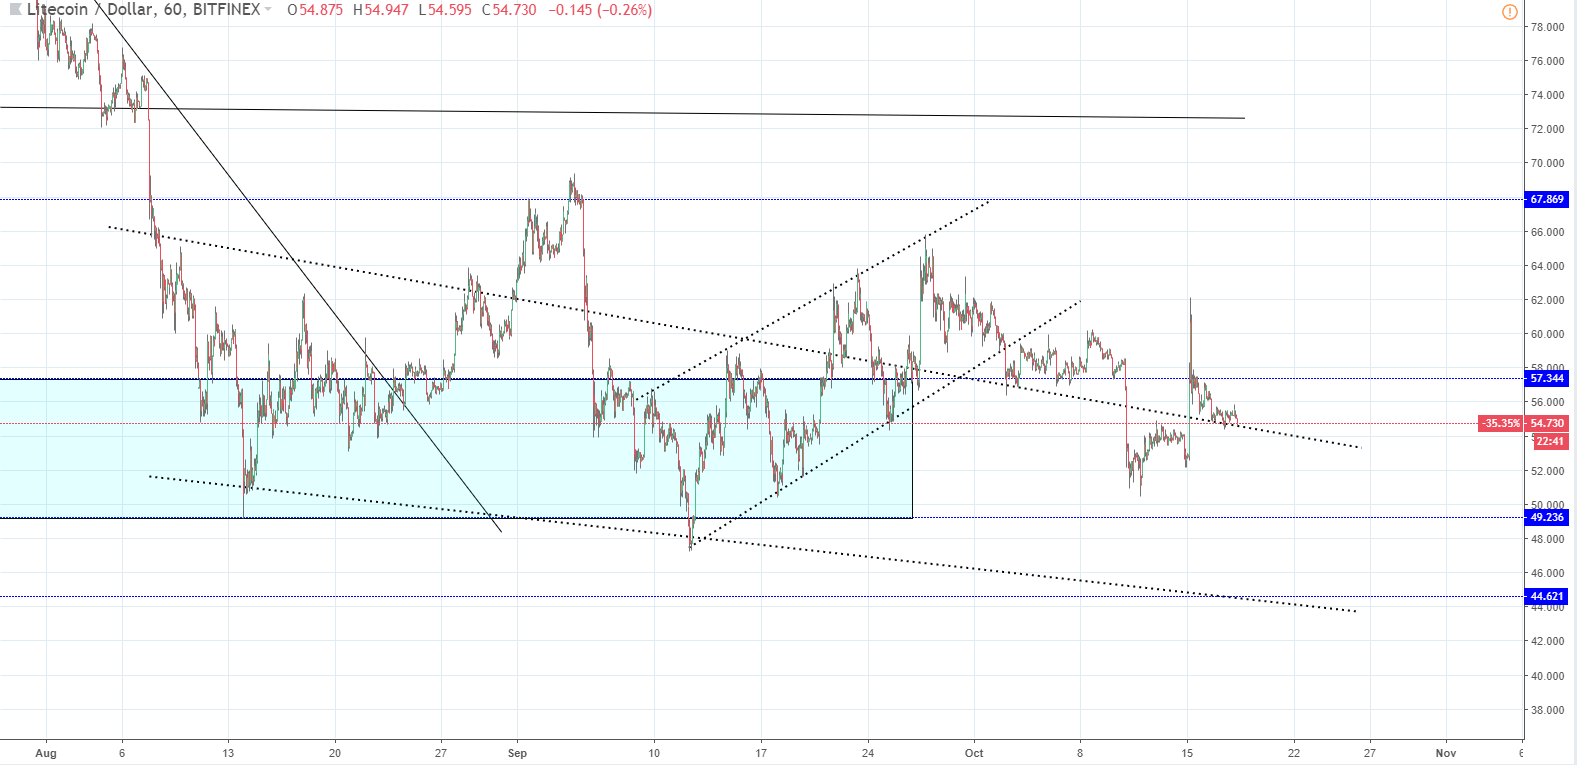
Looking at the hourly chart we can see that the price action is now back on the descending channels resistance line, which now serves as a support. As you can see, the price action formed an ascending channel that breaks out from the descending one. But it results in a painful and slow upward move followed by a massive red candle bringing the price back inside the territory of the descending channel. It happened on Monday and happened two more times previously. I believe that this will happen this time as well and the price is heading down to the lower support zone line at $49.2 or even lower to the support zone lower line 2 at $44.62.
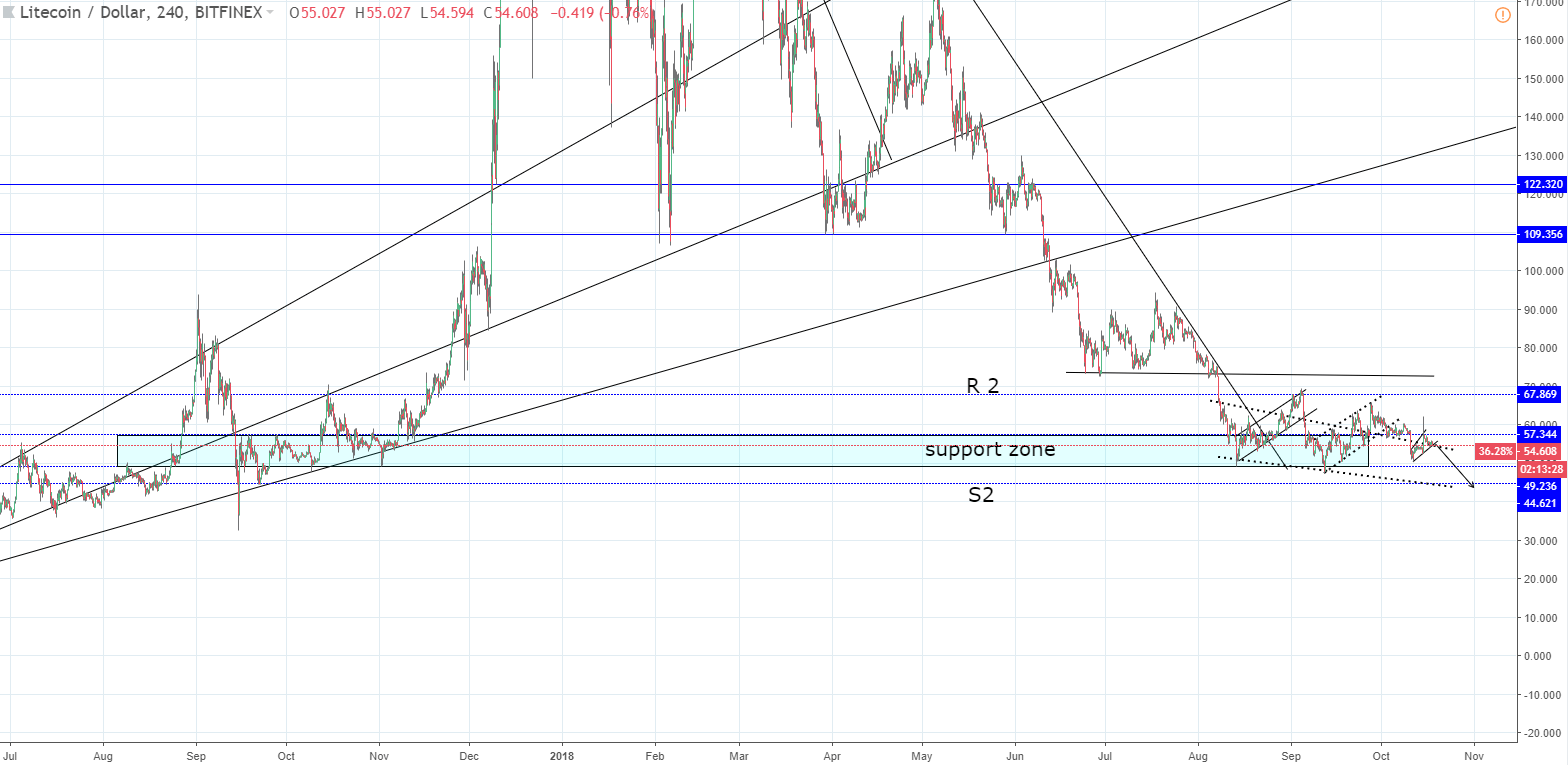
Zooming out on to the 4-hour chart you can clearly see where these significant horizontal levels originate from, and that zone was the main plateau from which the all-time high was made. It would be very significant to break it as it serves as a strong support and was well respected in the past. The price hasn’t gone below it since August last year.
Elliott Wave Projection
Looking at the daily chart below you can see the Elliott Wave labelings. As you can see after a WXY move, which pushed the price to the first lower level of the support zone, an ABCDE correction has developed. This is this current cluster around the support zone.
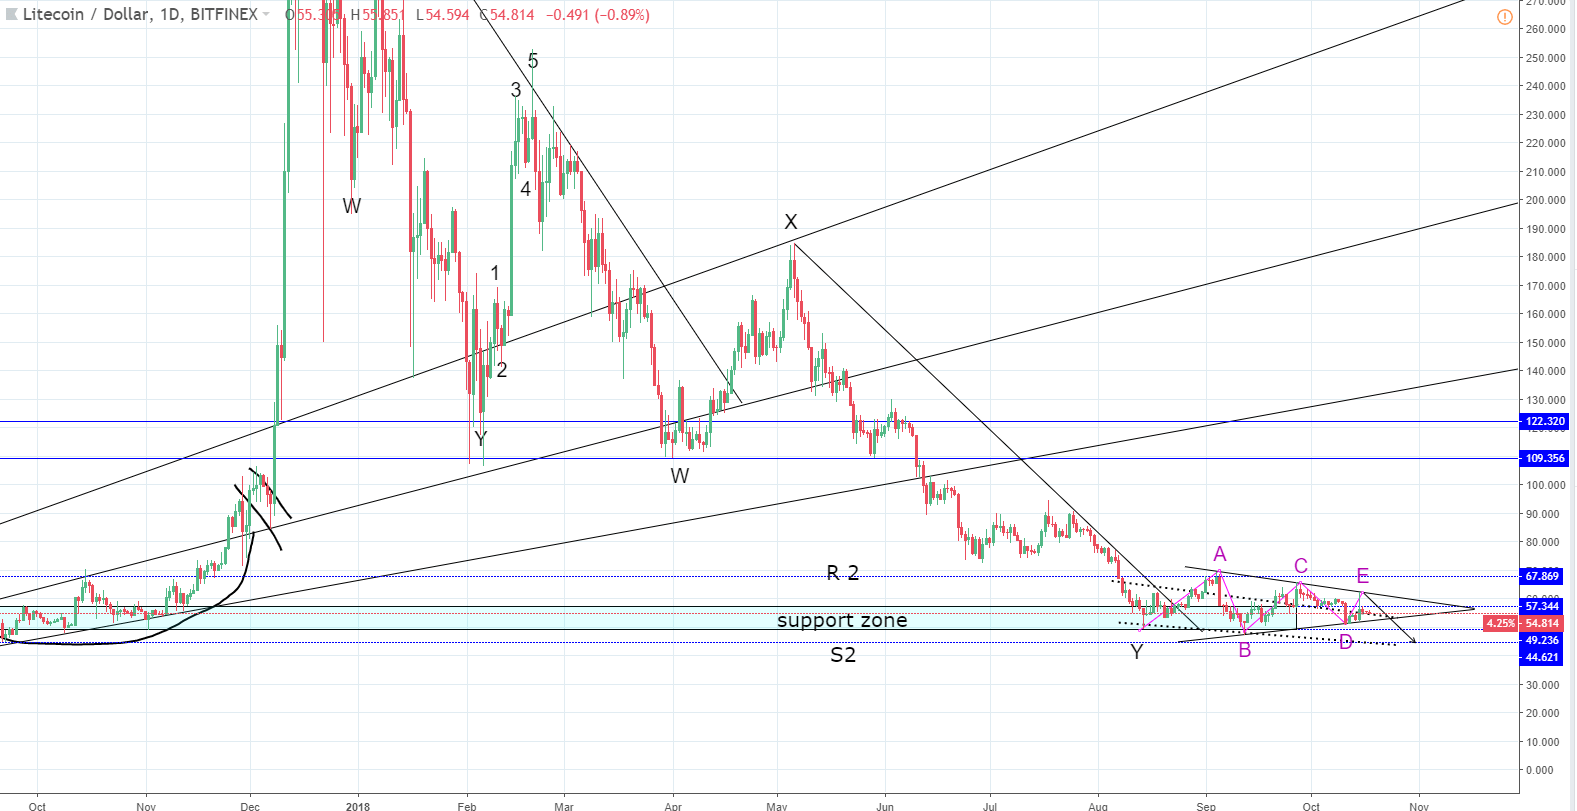
As the E wave ends on the resistance line, more downside is expected at least to the S2 of the support zone or potentially a breakout from it and even a lower target below $44.
EOS/USD
From the levels of Monday’s spike at $6 the price of Eos has fallen by 8.86% and is currently trading at $5.55.
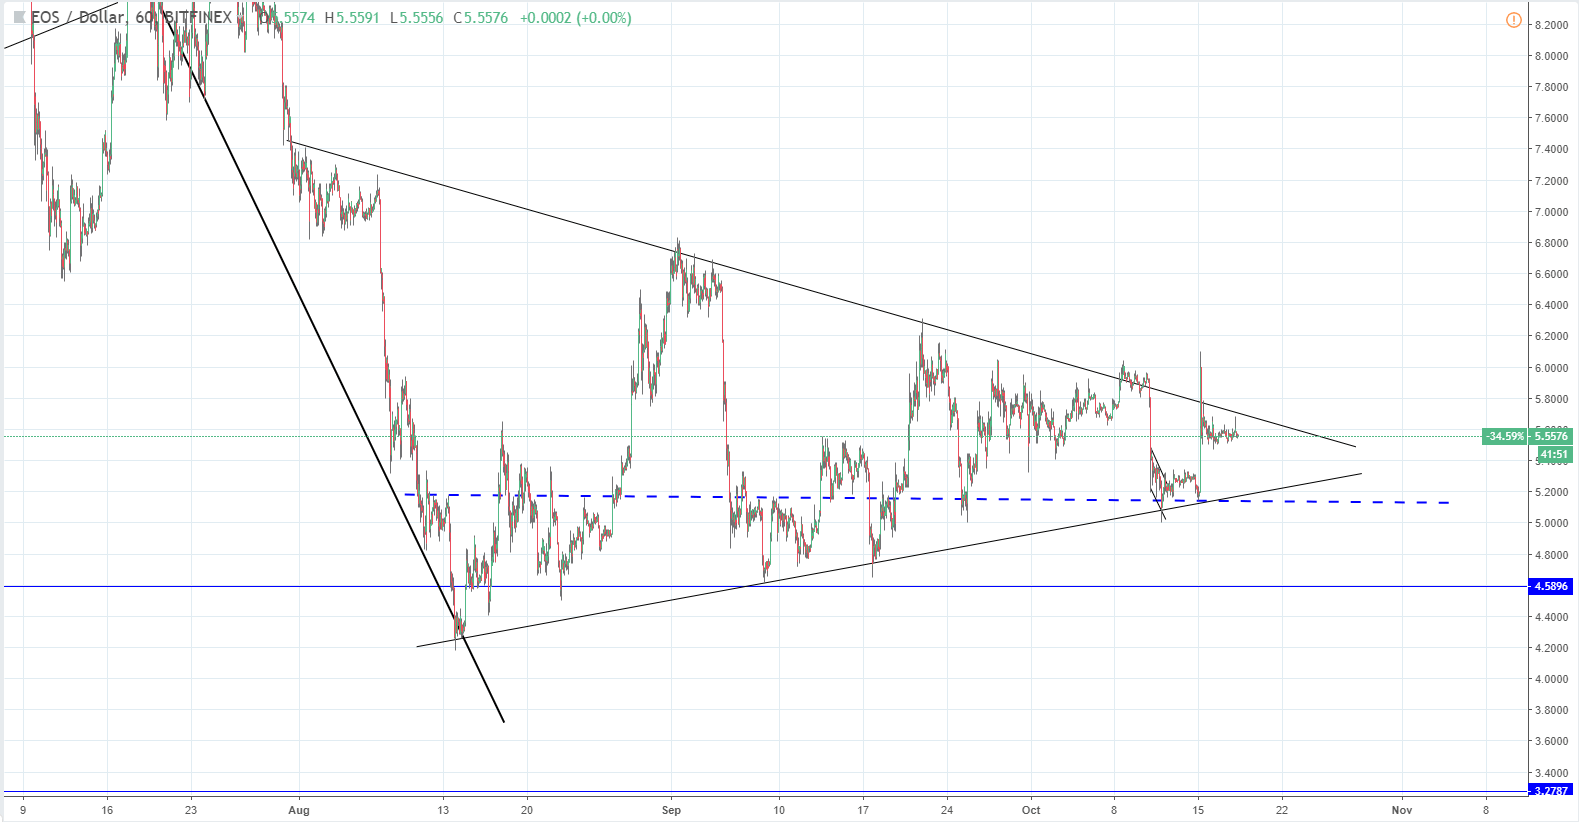
Looking at the hourly chart we can see a similar chart pattern to that of Litecoin – a bearish pennant. The price action is currently below its resistance line while the spike on Monday was above it. Sellers have pushed the price back inside the territory of the triangle and the price is hovering around the midpoints of the spike from the horizontal level at $5.15 to the high at $6.08.
Zooming out onto the 4-hour chart we can see that the price has broken out off of the downtrend resistance line prior to the formation of the bearish pennant.
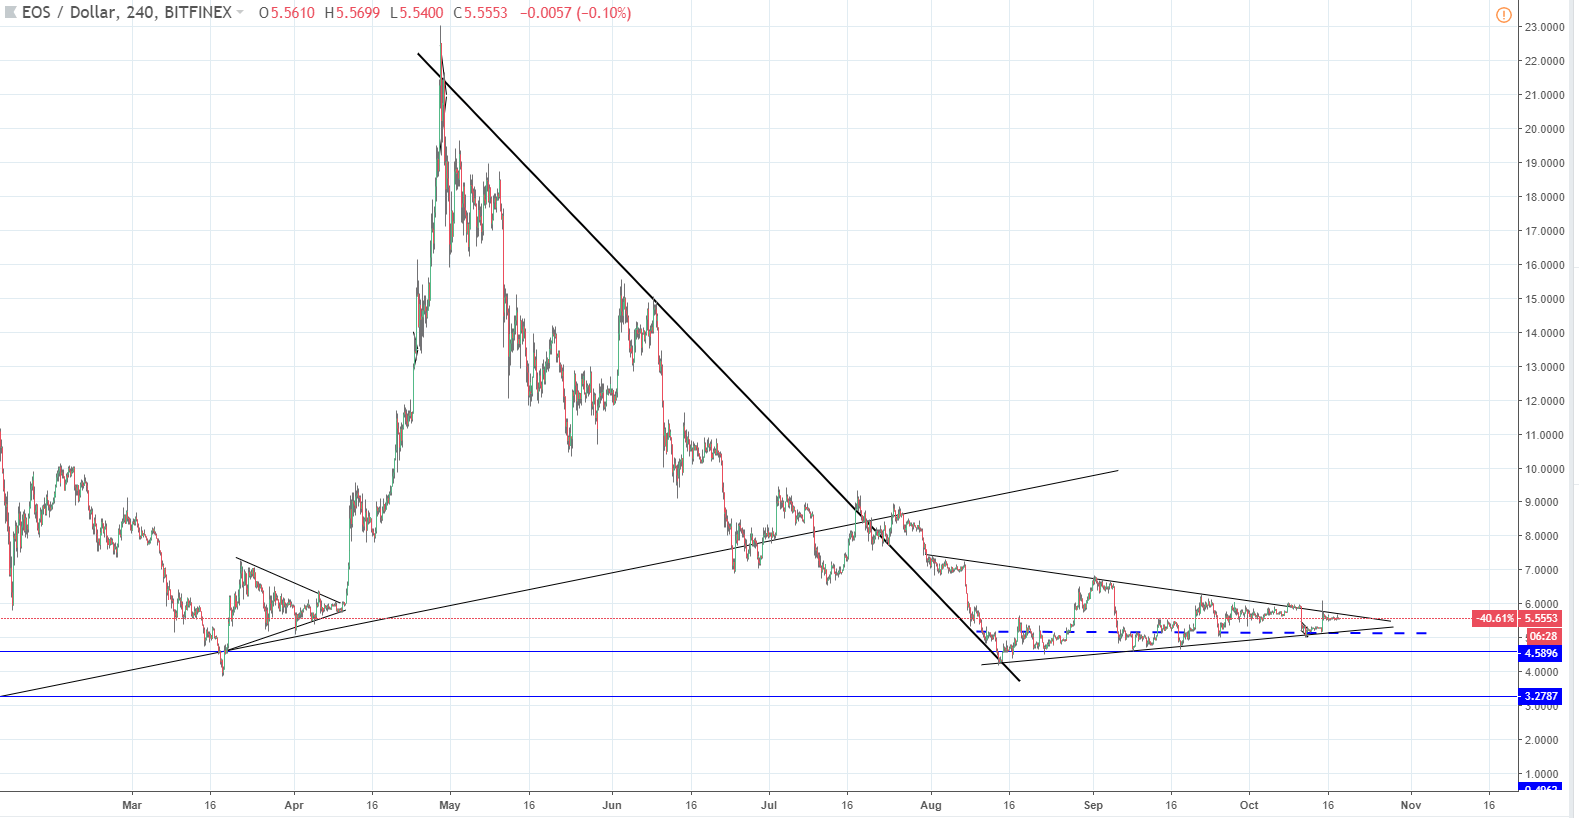
Judging by the momentum behind the selloff the price is heading further lower after this last consolidative triangle. The price might break out from the upside and go to retest the uptrends baseline support, which now serves as resistance but will continue to a lower low afterward in either case.
Elliott Wave Projection
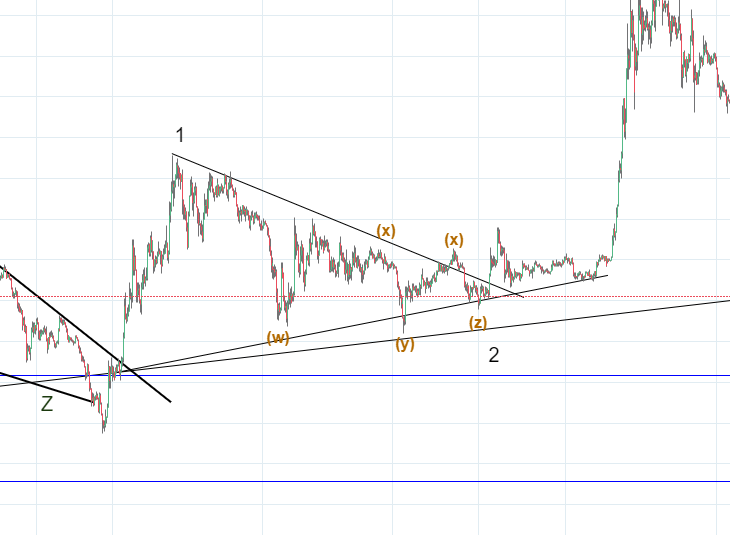
One could argue that the consolidative triangle we are currently seeing will end as a baseline for another increase in price like it did last time in March. But according to my Elliott Wave count, this isn’t the case. Last time we’ve seen a triangle the correction inside it ended on its support and was impulsive.
As you can see from the graph on the left, the correction was a WXYXZ followed by an impulsive move after the Z wave from a higher degree ended previously.
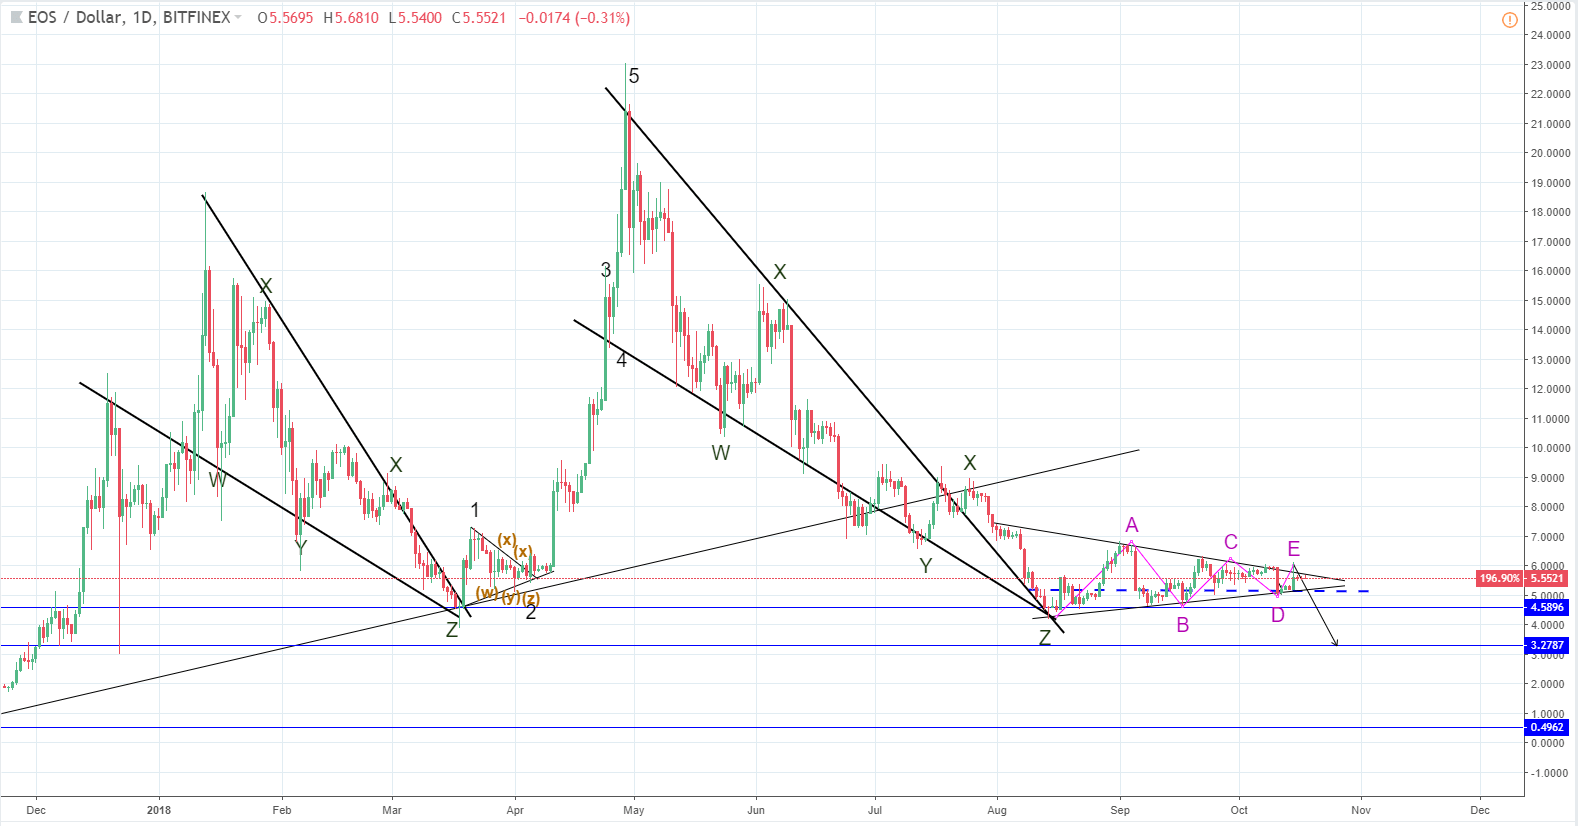
Looking at the daily chart below you can see the Elliott Wave labelings and the price context for the mentioned correction.
The current triangle, which can be interpreted as a bearish pennant, is not corrective after an impulsive move. It is consolidative after the price decreased by 76% from the all-time high. When the price ends consolidating, which is going to happen very soon, a trend continuation will occur pushing the price lower at least around to $4.5. But my target is on the next horizontal support level at $3.27.
Trade altcoins on FXOpen Crypto accounts.
FXOpen offers the world's most popular cryptocurrency CFDs*, including Bitcoin and Ethereum. Floating spreads, 1:2 leverage — at your service (additional fees may apply). Open your trading account now or learn more about crypto CFD trading with FXOpen.
*Important: At FXOpen UK, Cryptocurrency trading via CFDs is only available to our Professional clients. They are not available for trading by Retail clients. To find out more information about how this may affect you, please get in touch with our team.
This article represents the opinion of the Companies operating under the FXOpen brand only. It is not to be construed as an offer, solicitation, or recommendation with respect to products and services provided by the Companies operating under the FXOpen brand, nor is it to be considered financial advice.
Stay ahead of the market!
Subscribe now to our mailing list and receive the latest market news and insights delivered directly to your inbox.


Latest articles

US Dollar Strengthens Amid Equity Market Weakness and Hawkish Fed Rhetoric
The US dollar continues to hold firm near multi-year highs as sentiment across equity markets deteriorates and investors increasingly expect the Federal Reserve to maintain a restrictive monetary policy stance for longer. The US economy remains resilient, while inflation risks

Bitcoin: Corrective Channel Broken as Traders Turn More Active
Bitcoin has come under the influence of several factors simultaneously. The wave of selling at the beginning of June was linked to Strategy's first disclosed Bitcoin sale in several years, a prolonged series of outflows from spot ETFs, and a

DAX 40: consolidation amid technology sell-off
A wave of selling in the technology sector that emerged earlier this week has weighed on European equities. The trigger was investor concern over the profitability of large-scale debt-funded investments by major US tech companies in AI infrastructure. The Nasdaq