


More of the Same as Bitcoin Still Range-bound
FXOpen
Another week has passed and not much is changed. Both Bitcoin and Litecoin and still consolidating.Bitcoin is currently quoted at $228.49 dollars, just 41 cents below the price noted in last week’s article. You can see the effect of bitcoin’s consolidation across the crypto-market. For example Litecoin is trading at $2.82, about 4 cents higher, just 1.4 in percentage terms.
Bitcoin Still Range-bound
While BTC is pushing on the lower bounds and making new lows, it has yet to make a decisive breakdown. In the past seven days, the total range has been only $10 dollars and 59 cents, with a high at $234.59 and a low at $224. Today we hit new multi-day lows at $224 but this was quickly followed by a sharp rally to $230.48.
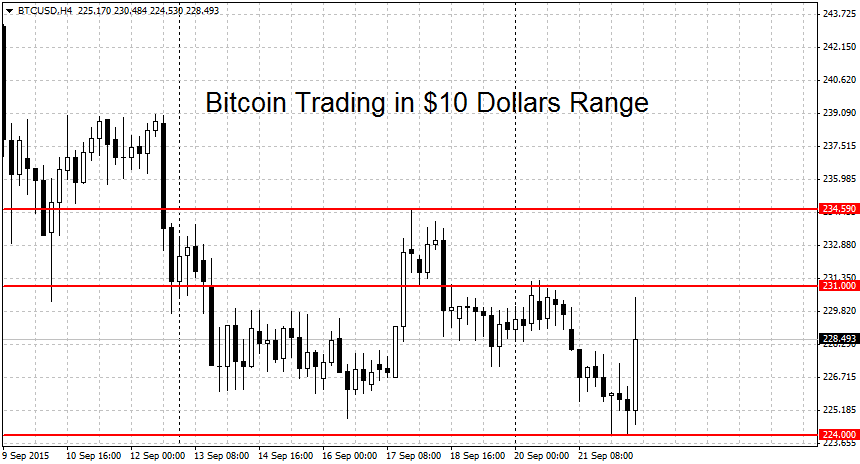
But even though currently we are not getting much movement, slow periods like these are usually followed by breakouts. We can’t know when that will happen but it pays to be prepared. The important breakout levels start with $250 on the upside. A clean move above this level should produce a new BTC rally.
On the downside, things are more complicated. We have several weak support levels here, starting with $220, followed by $216 and ending with the $210 former double bottom. For the conservative entry, waiting for a breakdown below $210 seems prudent. This is the strongest level of the three and a decisive break below it should extend the losses.
Further down we find more support at the August 25th $192 swing low. This is followed by the year’s low for bitcoin at $162 dollars per coin.
Litecoin Up Slightly at 1.4 Percent
Alternative crypto-currency Litecoin is following big brother bitcoin in range. In the past seven days since our last update, LTC/USD traded between $2.70 and $3.01 dollars per coin. We are currently quoted at $2.82, only 1.4 percent above the price in our previous LTC update.
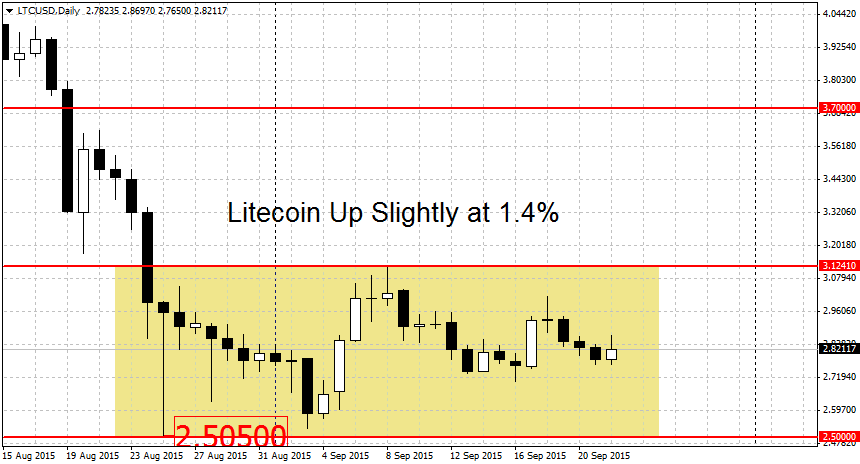
For Litecoin the situation looks much clearer, with two distinct breakout levels. On the topside, a breakout above $3.18 may jump-start a new rally. This is slightly above the $3.12 swing high of the current range. Meanwhile on the lower end, a break below the $2.50 swing low may trigger a new downtrend. Further down more support can be found at $2.40 swing low. A breakdown below here could open the way to $2 dollars per coin.
FXOpen offers the world's most popular cryptocurrency CFDs*, including Bitcoin and Ethereum. Floating spreads, 1:2 leverage — at your service (additional fees may apply). Open your trading account now or learn more about crypto CFD trading with FXOpen.
*Important: At FXOpen UK, Cryptocurrency trading via CFDs is only available to our Professional clients. They are not available for trading by Retail clients. To find out more information about how this may affect you, please get in touch with our team.
This article represents the opinion of the Companies operating under the FXOpen brand only. It is not to be construed as an offer, solicitation, or recommendation with respect to products and services provided by the Companies operating under the FXOpen brand, nor is it to be considered financial advice.
Stay ahead of the market!
Subscribe now to our mailing list and receive the latest market news and insights delivered directly to your inbox.


Latest articles

Weekly Market Insights with Gary Thomson: The Week of Central Banks and Earnings
In this video, we’ll explore the key economic events and market trends, shaping the financial landscape. Get ready for insights into financial markets to help you navigate the week ahead. Let’s dive in!
In this episode of Market

Intel at a Crossroads: Earnings Beat Meets Technical Resistance
Intel has just delivered its strongest quarter in over fifteen years, and the market reaction says it all. Q2 2026 revenue surged 25% year-over-year to $16.1 billion, crushing the consensus estimate of $14.42 billion, while adjusted EPS of

Tesla: Complex Range Structure Breaks Down Following Quarterly Earnings
Tesla released its Q2 2026 results after the market closed on 22 July. Revenue increased 26% year-on-year to $28.24 billion, while vehicle deliveries reached a record 480,126 units. However, operating margin fell sharply to 1.4%, down from