


Most Frequently Occurred Price Patterns In Forex Trading
FXOpen

If you are a long term trader, then you should have a close eye on various price patterns that occur frequently at various timeframes. These patterns may yield huge and easy return with minimum risk. Let us have a look at some famous price patterns.
Head & Shoulder (H&S)
H&S is one of the most frequently occurred price patterns. It consists of four main parts that are:
- Left Shoulder
- Head
- Right Shoulder
- Neckline
The most important component is the neckline. Neckline is the lowest point between right and left shoulder as shown in following chart.
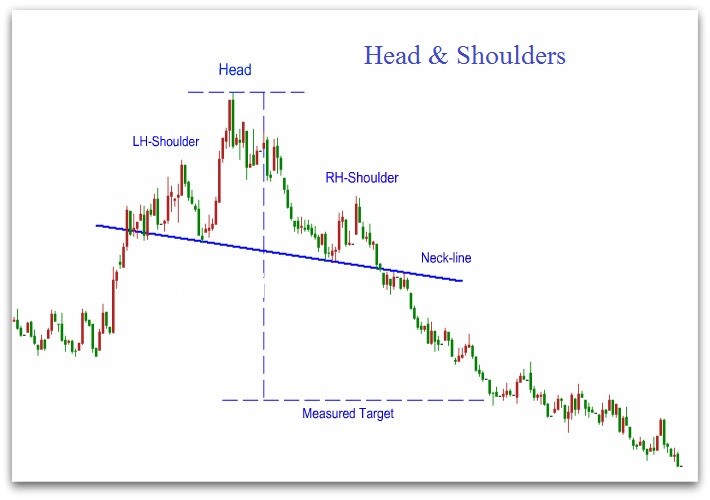
Traders tend to open sell positions when neckline is broken. Once neckline is broken, it then acts as critical resistance level. H&S pattern can also be in inverse shape as shown in following chart.
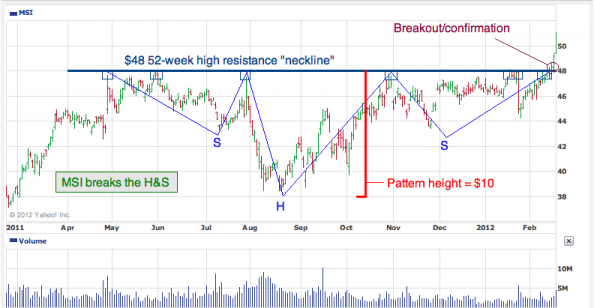
As obvious from above chart the only difference in inverse H&S pattern is that it is bullish price pattern, that’s the reason why traders tend to open buy positions when neckline of inverse H&S pattern is broken.
Double Top & Double Bottom Price Patterns
Double top price pattern signals bearish reversal while double bottom shows bullish reversal as obvious from following chart.
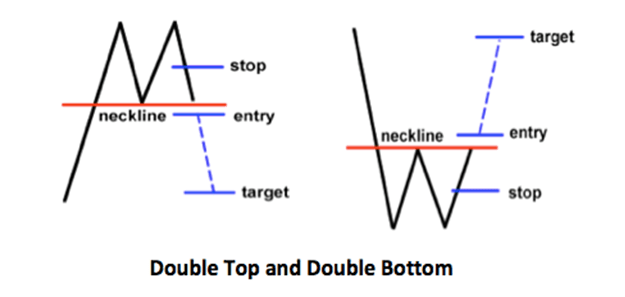
Just like H&S pattern, it also has a neckline. A breakout through neckline is considered a confirmation for reversal and positions are opened at this stage with stop loss placed just above the neckline. Target can be up to bottom of corresponding wave as shown in above diagram.
Symmetrical Triangles
Symmetrical triangles are also very common in daily trading. In uptrend markets, mostly upside breakout occurs and in downtrend markets, usually downside breakout occurs.
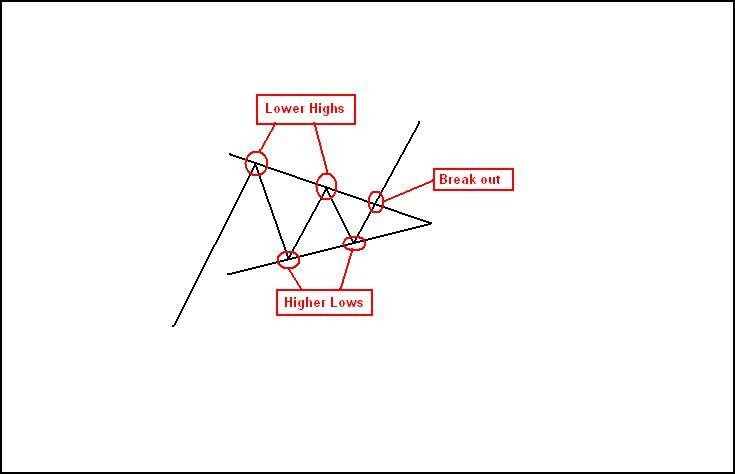
In symmetrical triangles, breakout trading is more successful as compared to pullback trading. A trader should open a position when breakout occurs. False breaks are very common in symmetrical triangles so you should wait until four-hour or daily candle is closed above or below trend-line.
ABCD Pattern
It is another commonly observed price pattern. ABCD pattern can be bullish or bearish as shown in following diagram.
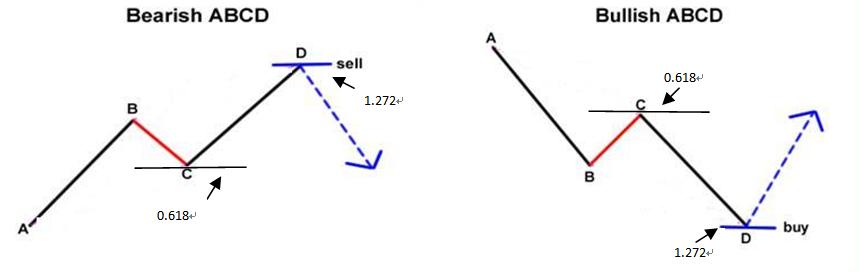
Price normally takes 61.8% retracement in wave C of both bullish and bearish ABCD patterns. No action should be taken until size of wave D is matched to wave A. Target of a position can be just ahead of peak level of wave C.
Above mentioned price patterns may occur at any timeframe however you should avoid trading these patterns at timeframe lesser than one hour. The higher the timeframe, higher will be reliability of a price pattern. Similarly premature entry must also be avoided, for example if you are trading H&S or double top price pattern, you must not open a position until neckline is broken.
Moreover, patience is very much needed while trading price patterns. Many of these patterns may take days, weeks or even months for completion, particularly when they occur at higher timeframe. So always be patient and never close your trade before completion of a price pattern.
This article represents the opinion of the Companies operating under the FXOpen brand only. It is not to be construed as an offer, solicitation, or recommendation with respect to products and services provided by the Companies operating under the FXOpen brand, nor is it to be considered financial advice.
Stay ahead of the market!
Subscribe now to our mailing list and receive the latest market news and insights delivered directly to your inbox.

Latest articles

USD/JPY and USD/CHF Near Key Levels: The Dollar Supported by the Fed
The US dollar continues to trend upwards following the Federal Reserve meeting, drawing support from the regulator’s moderately hawkish stance and comments by Jerome Powell. Markets interpret the Fed’s rhetoric as a signal that restrictive policy is likely

EUR/USD and GBP/USD consolidate ahead of the Fed decision
European currencies are showing subdued dynamics, entering a consolidation phase following their previous advance. Earlier, EUR/USD and GBP/USD broke out of their ranges and strengthened; however, the subsequent correction has led both pairs to retest the previously breached

Meta: V-Shaped Recovery Meets Heavy Volume Resistance
The movement in Meta Platforms shares is being driven by two competing narratives. On one hand, advertising revenue is benefiting from AI-based tools: the Advantage+ platform continues to support strong advertiser demand, and the analyst consensus for Q1 2026 revenue