


Amazon (AMZN) Stock Price Surpassed $230 for the First Time
FXOpen

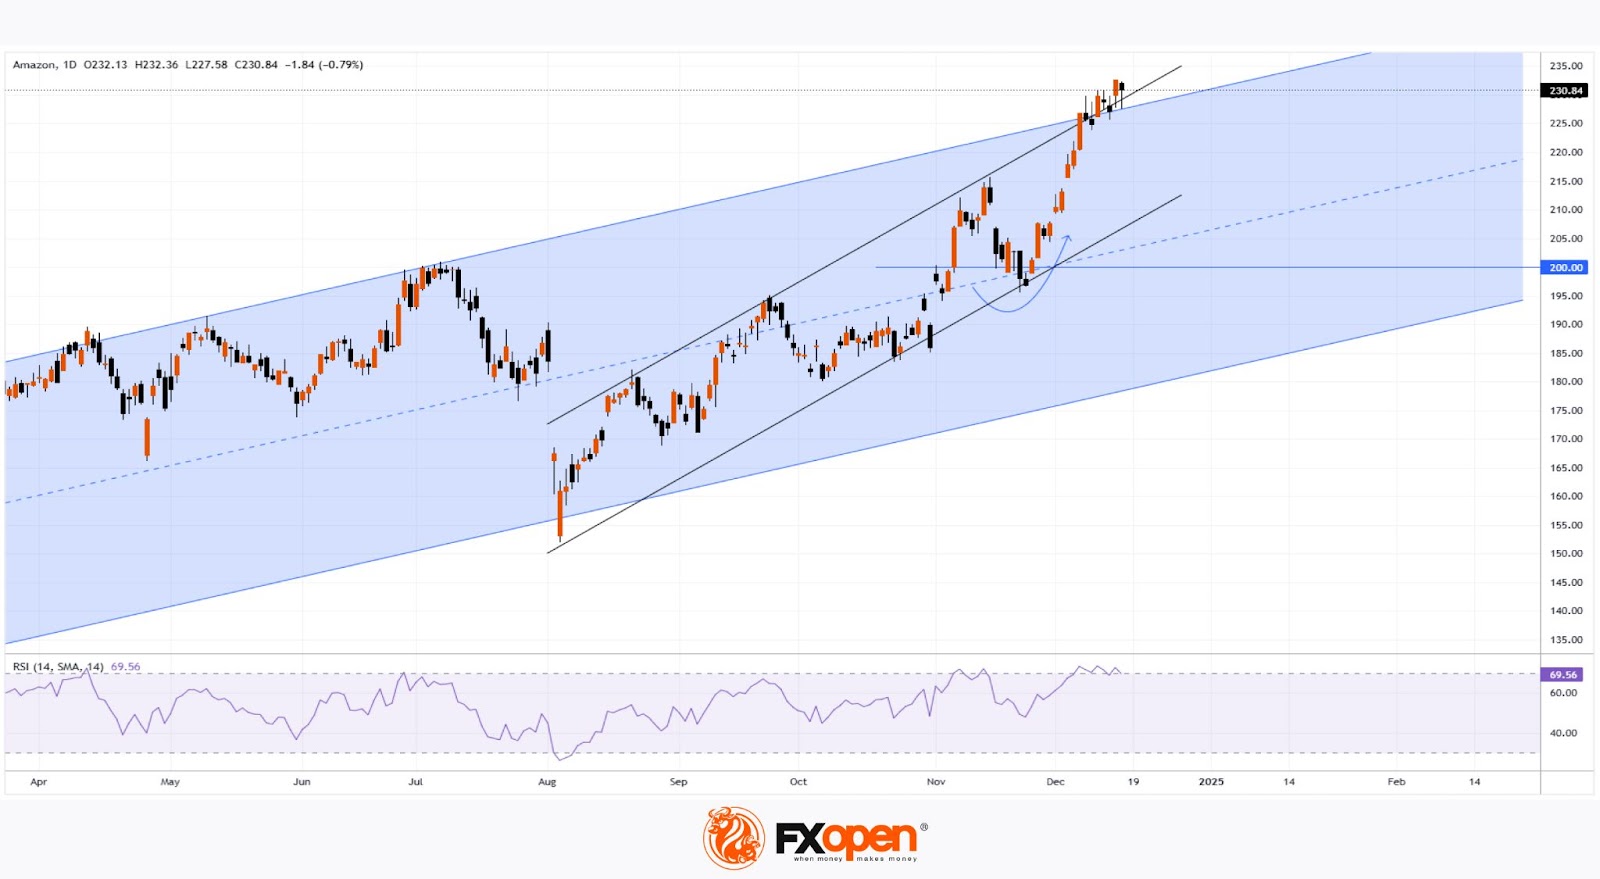
On 12th November, while analysing Amazon (AMZN) stock chart, we:
→ drew two ascending channels (a long-term one marked in blue and a steeper one represented by black lines);
→ anticipated a test of the $200 level as part of a correction.
According to the AMZN chart, since then:
→ the price corrected with a test of the $200 level (indicated by an arrow), aided by the median line of the blue channel;
→ it continued to climb within the mentioned channels, reaching a new all-time high — this week, the price hit $233.
Positive market sentiment is driven, among other factors, by:
→ Amazon's strong earnings report for the previous quarter;
→ expectations of a Federal Reserve rate cut, which helped the Nasdaq 100 index reach a new record, as we reported yesterday.
Can the price continue rising?
Technical analysis of Amazon’s stock chart today suggests this might be challenging because:
→ the price is near the resistance lines of both channels;
→ the RSI indicator is in the overbought zone, and you can spot a bearish divergence forming (a sign of weakening buyer momentum).
Given these arguments, the price could undergo a correction. If so, it might drop to the lower boundary of the short-term black channel.
According to TipRanks:
→ 45 out of 46 surveyed Wall Street analysts recommend buying AMZN stock;
→ on average, they predict AMZN’s price will reach $244 within 12 months.
Buy and sell stocks of the world's biggest publicly-listed companies with CFDs on FXOpen’s trading platform. Open your FXOpen account now or learn more about trading share CFDs with FXOpen.
This article represents the opinion of the Companies operating under the FXOpen brand only. It is not to be construed as an offer, solicitation, or recommendation with respect to products and services provided by the Companies operating under the FXOpen brand, nor is it to be considered financial advice.
Stay ahead of the market!
Subscribe now to our mailing list and receive the latest market news and insights delivered directly to your inbox.


Latest articles

Weekly Market Insights with Gary Thomson: US Inflation, UK GDP, Chair Warsh Testimony, and Earnings
In this video, we’ll explore the key economic events and market trends, shaping the financial landscape. Get ready for insights into financial markets to help you navigate the week ahead. Let’s dive in!
In this episode of Market

GBP/AUD Analysis: The Tug-of-War Begins
Oil is back in the driver's seat, and both the pound and the aussie are feeling its grip. The Bank of England held rates at 3.75% in June, but with UK inflation at 2.8% and crude oil climbing

Australian Dollar Holds Above the Current Market Profile
The minutes from the Reserve Bank of Australia's (RBA) June meeting, released on 30 June, suggested that policymakers are not yet ready to rule out further policy tightening. Board members noted persistent excess demand and broad-based inflationary pressures across the