


AMZN: Stock Price Ends Year Stronger Than S&P 500
FXOpen

Amazon shares are up approximately 79% year to date in 2023, outperforming the S&P 500. This reflects the company's strong fundamentals:
→ Amazon's third-quarter results beat Wall Street estimates, helped by growth in its cloud and advertising businesses. According to Barchart, analysts are forecasting AMZN's earnings growth of 35% in fiscal 2024, as well as revenue growth of 11%.
→ Positive forecasts are associated with the activation of retail trade. In the past three months alone, the SPDR S&P Retail ETF has gained 16.4%, significantly outpacing the S&P 500's 6.8% gain over the same period, according to FactSet data. Therefore, AMZN could benefit significantly from the holiday shopping season.
→ Analysts are praising the prospects of the Prime platform, which will soon broadcast games involving 40 major league teams in baseball, basketball and hockey.
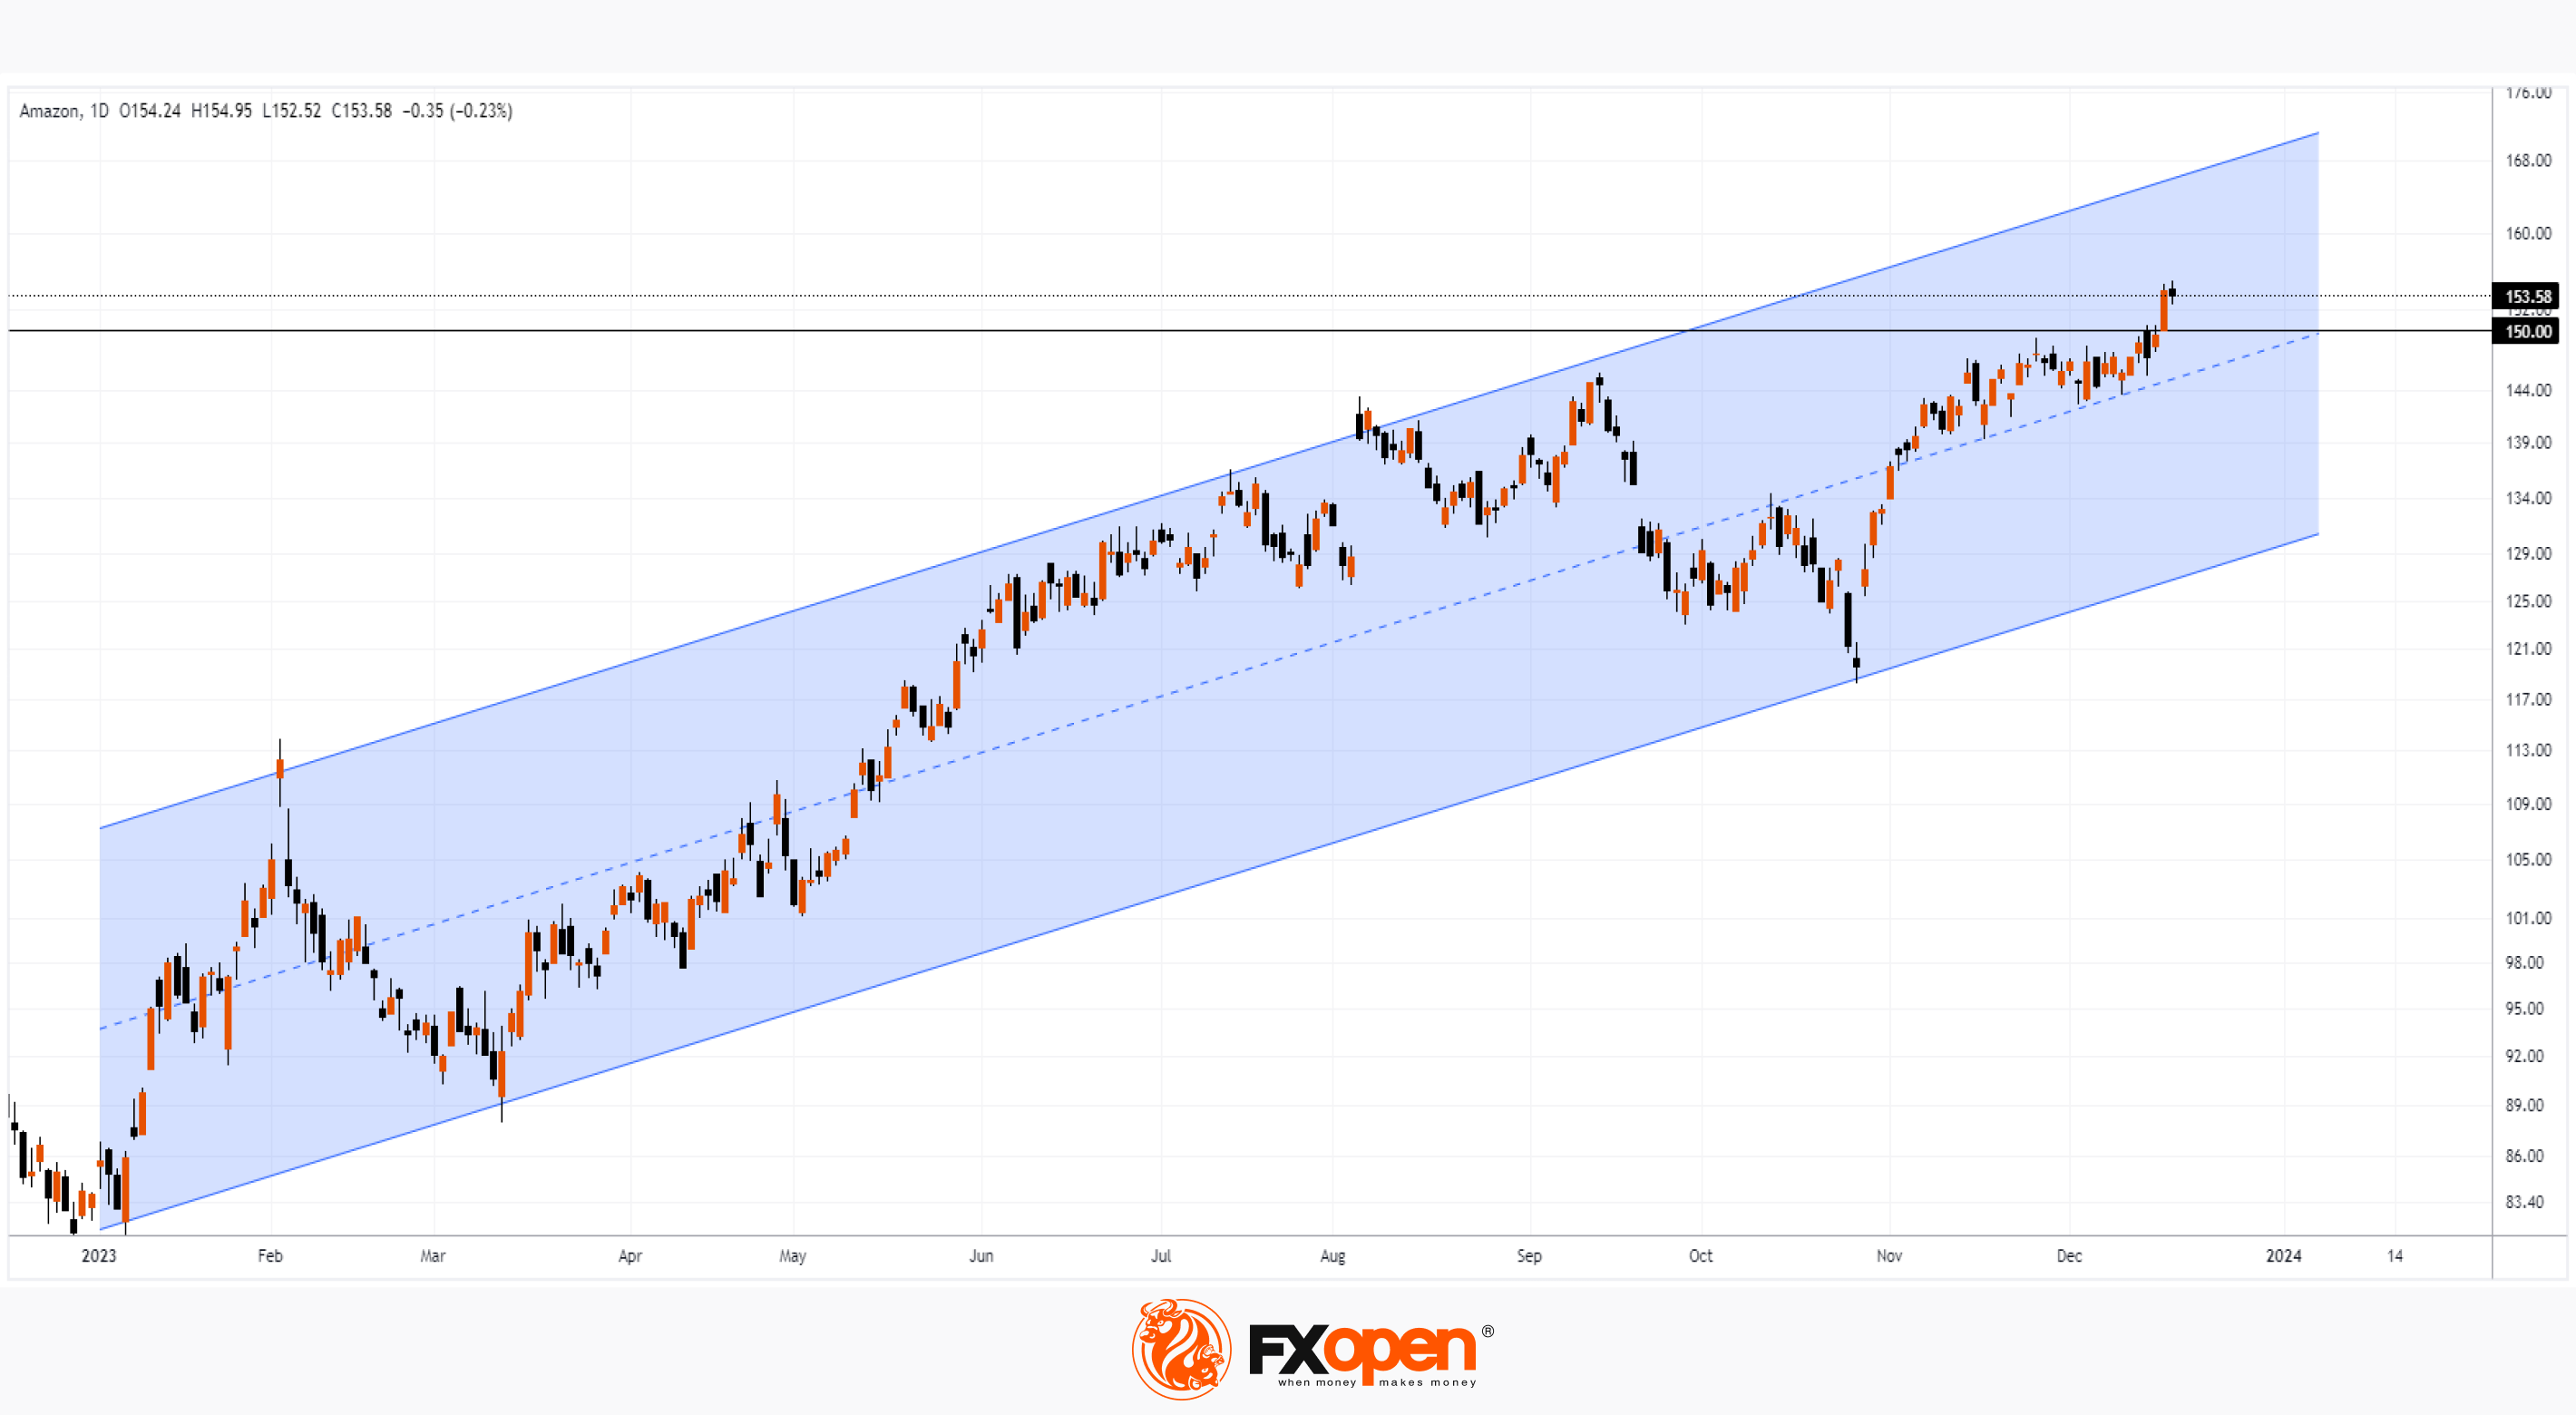
The chart shows that the AMZN stock price is moving steadily within the ascending channel (shown in blue). Wherein:
→ the price quickly rebounded from its lower border at the end of October - a sign of strong demand;
→ the price is able to stay in the upper half of the channel, using its median line as support and forming rising lows in December;
→ at the beginning of the new week, the price exceeded the psychological level of USD 150, setting a high of the year.
Now the bulls need to consolidate the progress made and keep the price above the psychological level — it is possible that we will see a test of the USD 150 level, which previously acted as resistance, therefore, there is reason to expect that it will serve as support. It is possible that the bulls will try to update the fresh high of the year.
Buy and sell stocks of the world's biggest publicly-listed companies with CFDs on FXOpen’s trading platform. Open your FXOpen account now or learn more about trading share CFDs with FXOpen.
This article represents the opinion of the Companies operating under the FXOpen brand only. It is not to be construed as an offer, solicitation, or recommendation with respect to products and services provided by the Companies operating under the FXOpen brand, nor is it to be considered financial advice.
Stay ahead of the market!
Subscribe now to our mailing list and receive the latest market news and insights delivered directly to your inbox.


Latest articles

AI Valuations Are Back in the Spotlight
Artificial intelligence remains the dominant investment theme of 2026, but investors are increasingly questioning whether AI stock valuations are keeping pace with reality.
💰 Big Tech continues to invest at an unprecedented scale, with hyperscaler AI spending projected to exceed $800

AUD/CAD: Months of Indecision — Is a Breakout Finally Coming?
The Australian dollar has clawed back most of its end-of-June losses, when it touched three-month lows against the greenback amid escalating Middle East tensions. Since then, sentiment has improved: the RBA's Assistant Governor Sarah Hunter signalled the board stands ready

USD/JPY: Battling at the Top of the Triangle
On 3 July, Japan's Finance Minister, Satsuki Katayama, stated that the Ministry of Finance remains in close contact with US authorities regarding developments in USD/JPY as the yen traded near its weakest level in almost 40 years. Similar verbal