An Important Bullish Breakout in the Natural Gas Market
FXOpen

The price of natural gas in USD rose sharply on Thursday after the US Energy Information Administration (EIA) reported a slightly smaller-than-expected weekly increase in domestic natural gas inventories.
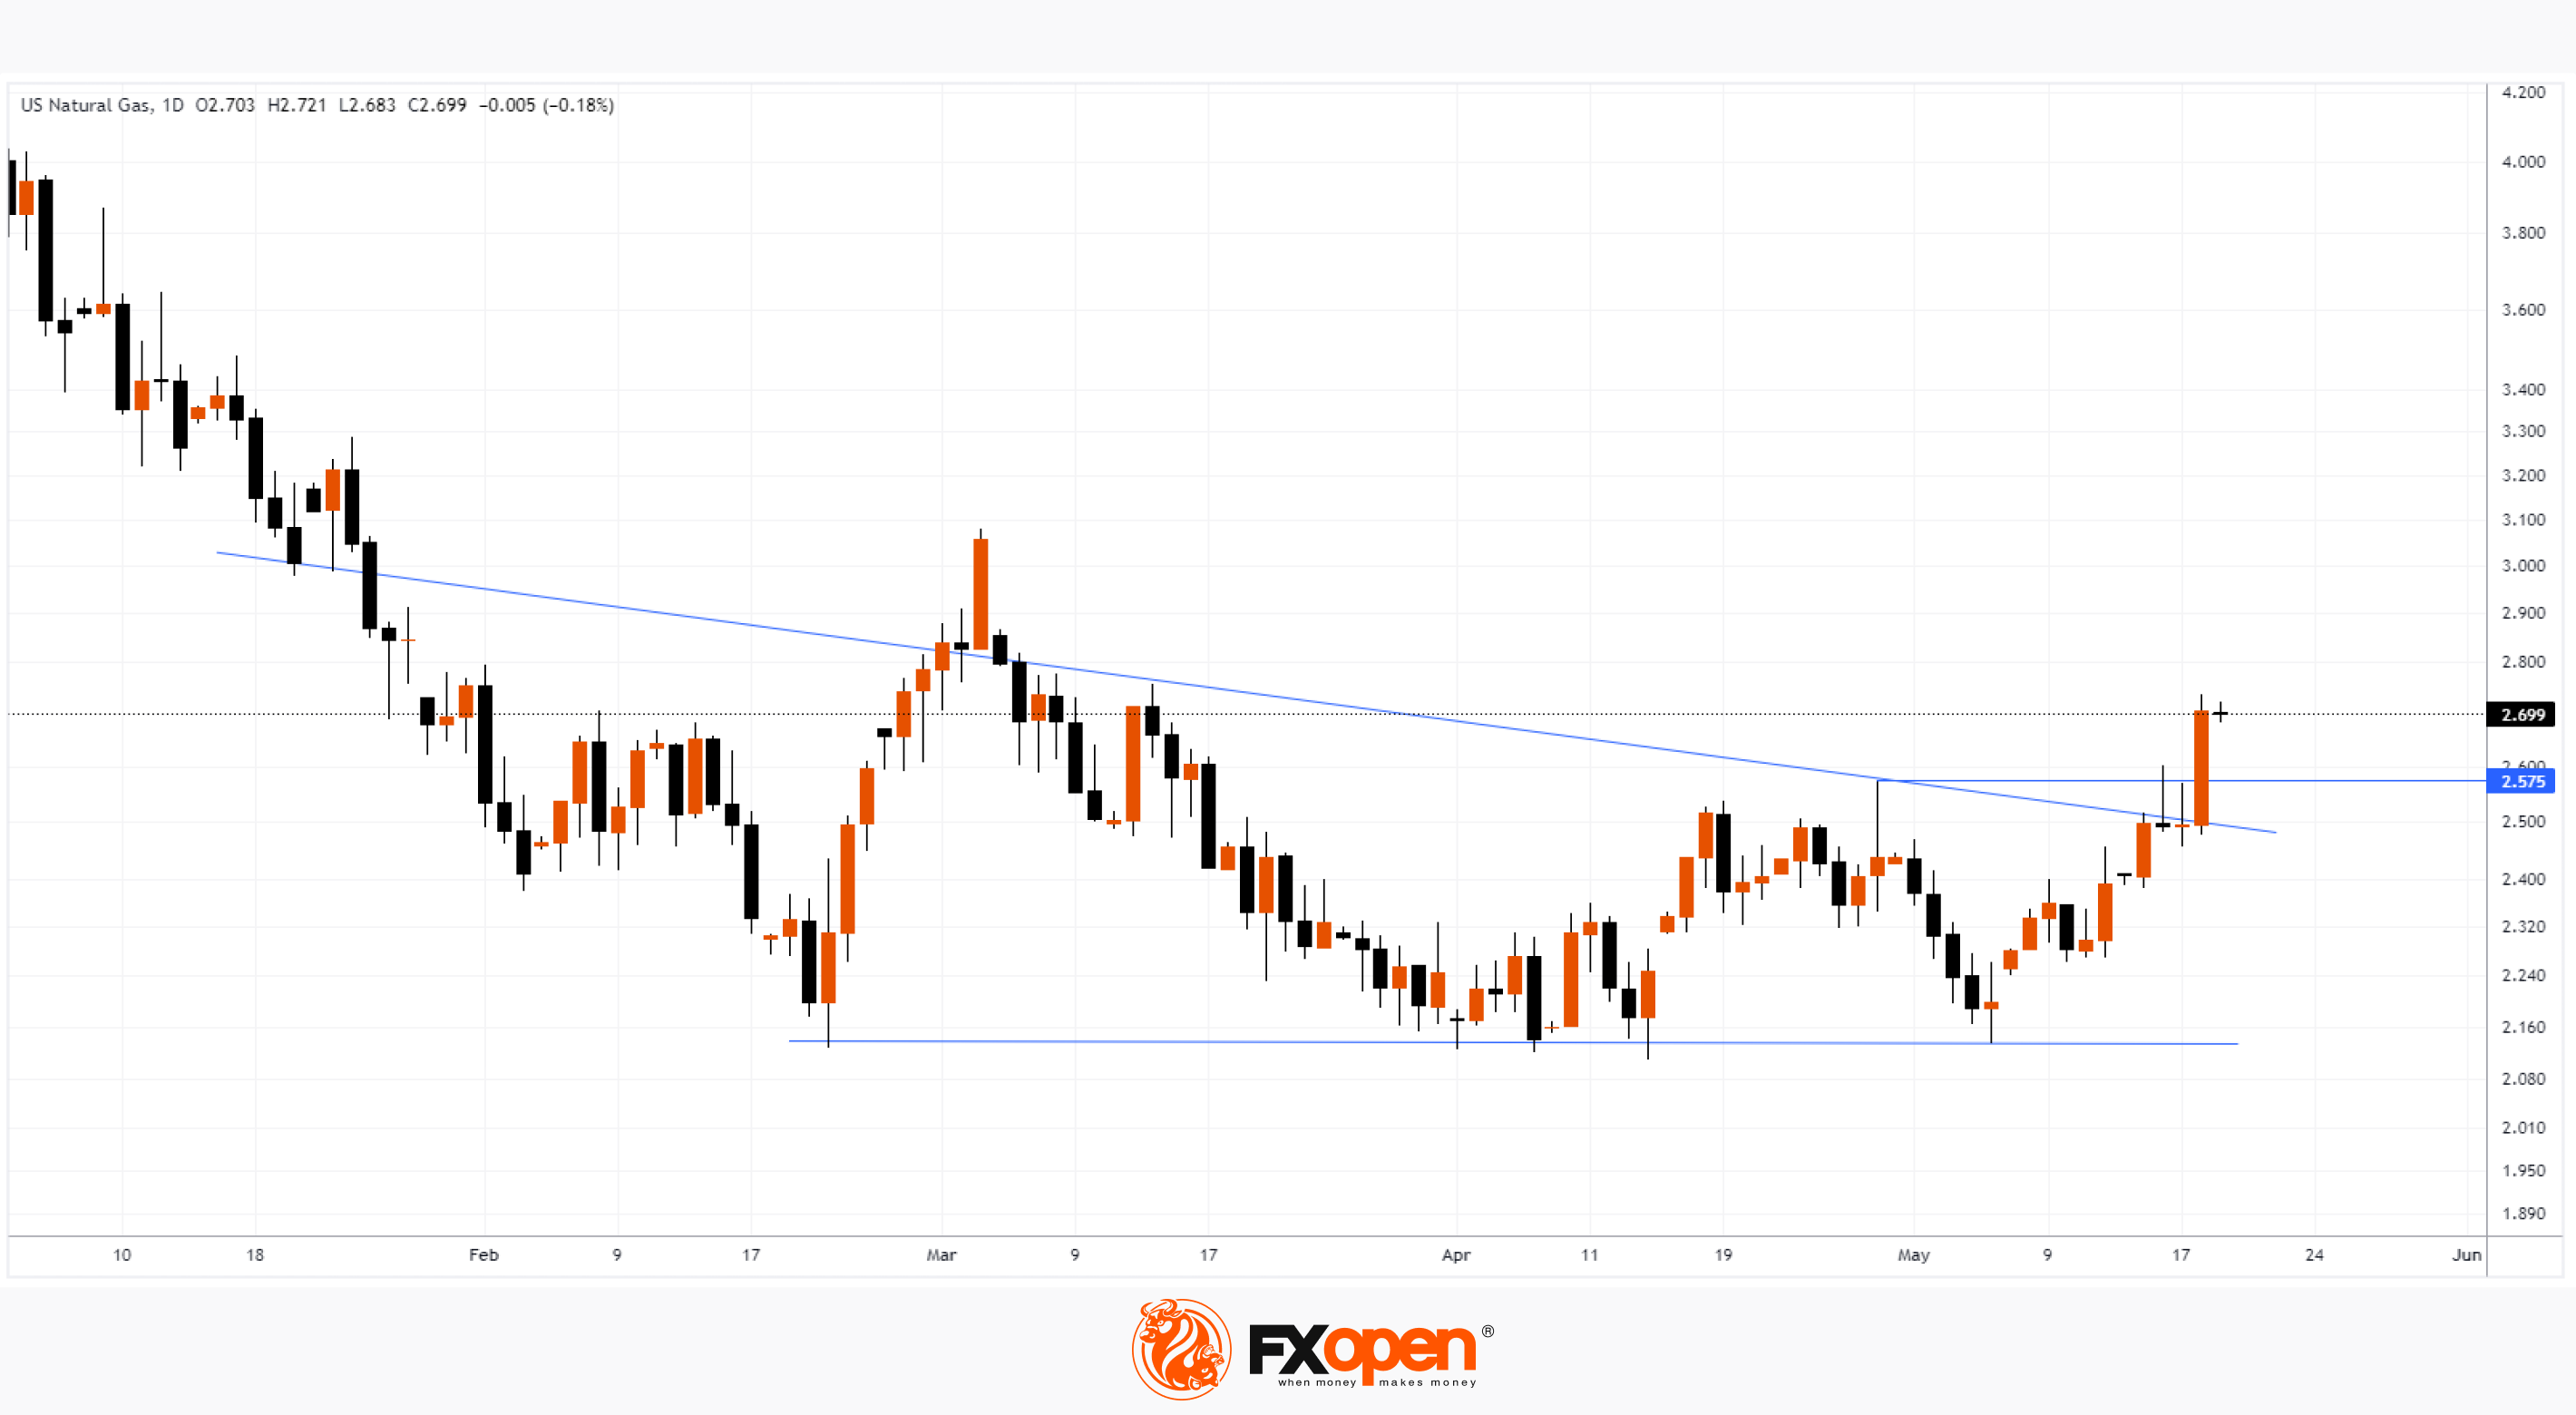
At the same time, an important breakdown of the contracting triangle pattern formed by 2 lines (shown in blue) has formed on the XNG/USD natural gas chart.
Presumably, this triangle delineates a market stage in which large players could accumulate long positions at low prices after the downtrend that has been in place in the natural gas market since the beginning of 2023.
On Friday morning, the bulls are able to keep the progress made, keeping the price of XNG above the former resistance at 2.575, which can now serve as support.
This breakdown may become a stage in the development of an important bullish trend. We previously reported that according to EIA forecasts, the average price of natural gas in 2023 could exceed USD 4.
Start trading commodity CFDs with tight spreads (additional fees may apply). Open your trading account now or learn more about trading commodity CFDs with FXOpen.
This article represents the opinion of the Companies operating under the FXOpen brand only. It is not to be construed as an offer, solicitation, or recommendation with respect to products and services provided by the Companies operating under the FXOpen brand, nor is it to be considered financial advice.
Stay ahead of the market!
Subscribe now to our mailing list and receive the latest market news and insights delivered directly to your inbox.


Latest articles

Market Analysis: GBP/USD Turns Bullish Again While EUR/GBP Drops More
GBP/USD is showing positive signs above 1.3440 and 1.3460. EUR/GBP declined and is now consolidating losses below 0.8680.
Important Takeaways for GBP/USD and EUR/GBP Analysis Today
· The British Pound started a fresh increase
Netflix 2026: Reversal on the Deal, Pullback on Earnings
Fundamental Background
At the end of February, Netflix withdrew from the bid for Warner Bros. Discovery assets after WBD’s board deemed Paramount Skydance’s $31-per-share offer more attractive. Netflix chose not to raise its own bid of $27.75