


Brent Oil Price Faces Key Resistance Zone Amid Geopolitical Tensions
FXOpen

The reasons for the rise in Brent oil prices are a drone attack on an American military base in Jordan, as well as an attack on an oil tanker in the Red Sea. These events cause concerns about the safety of oil transportation through the Red Sea and the potential escalation of the conflict in the Middle East. Bloomberg writes that President Biden is under pressure, and the response can be decisive.
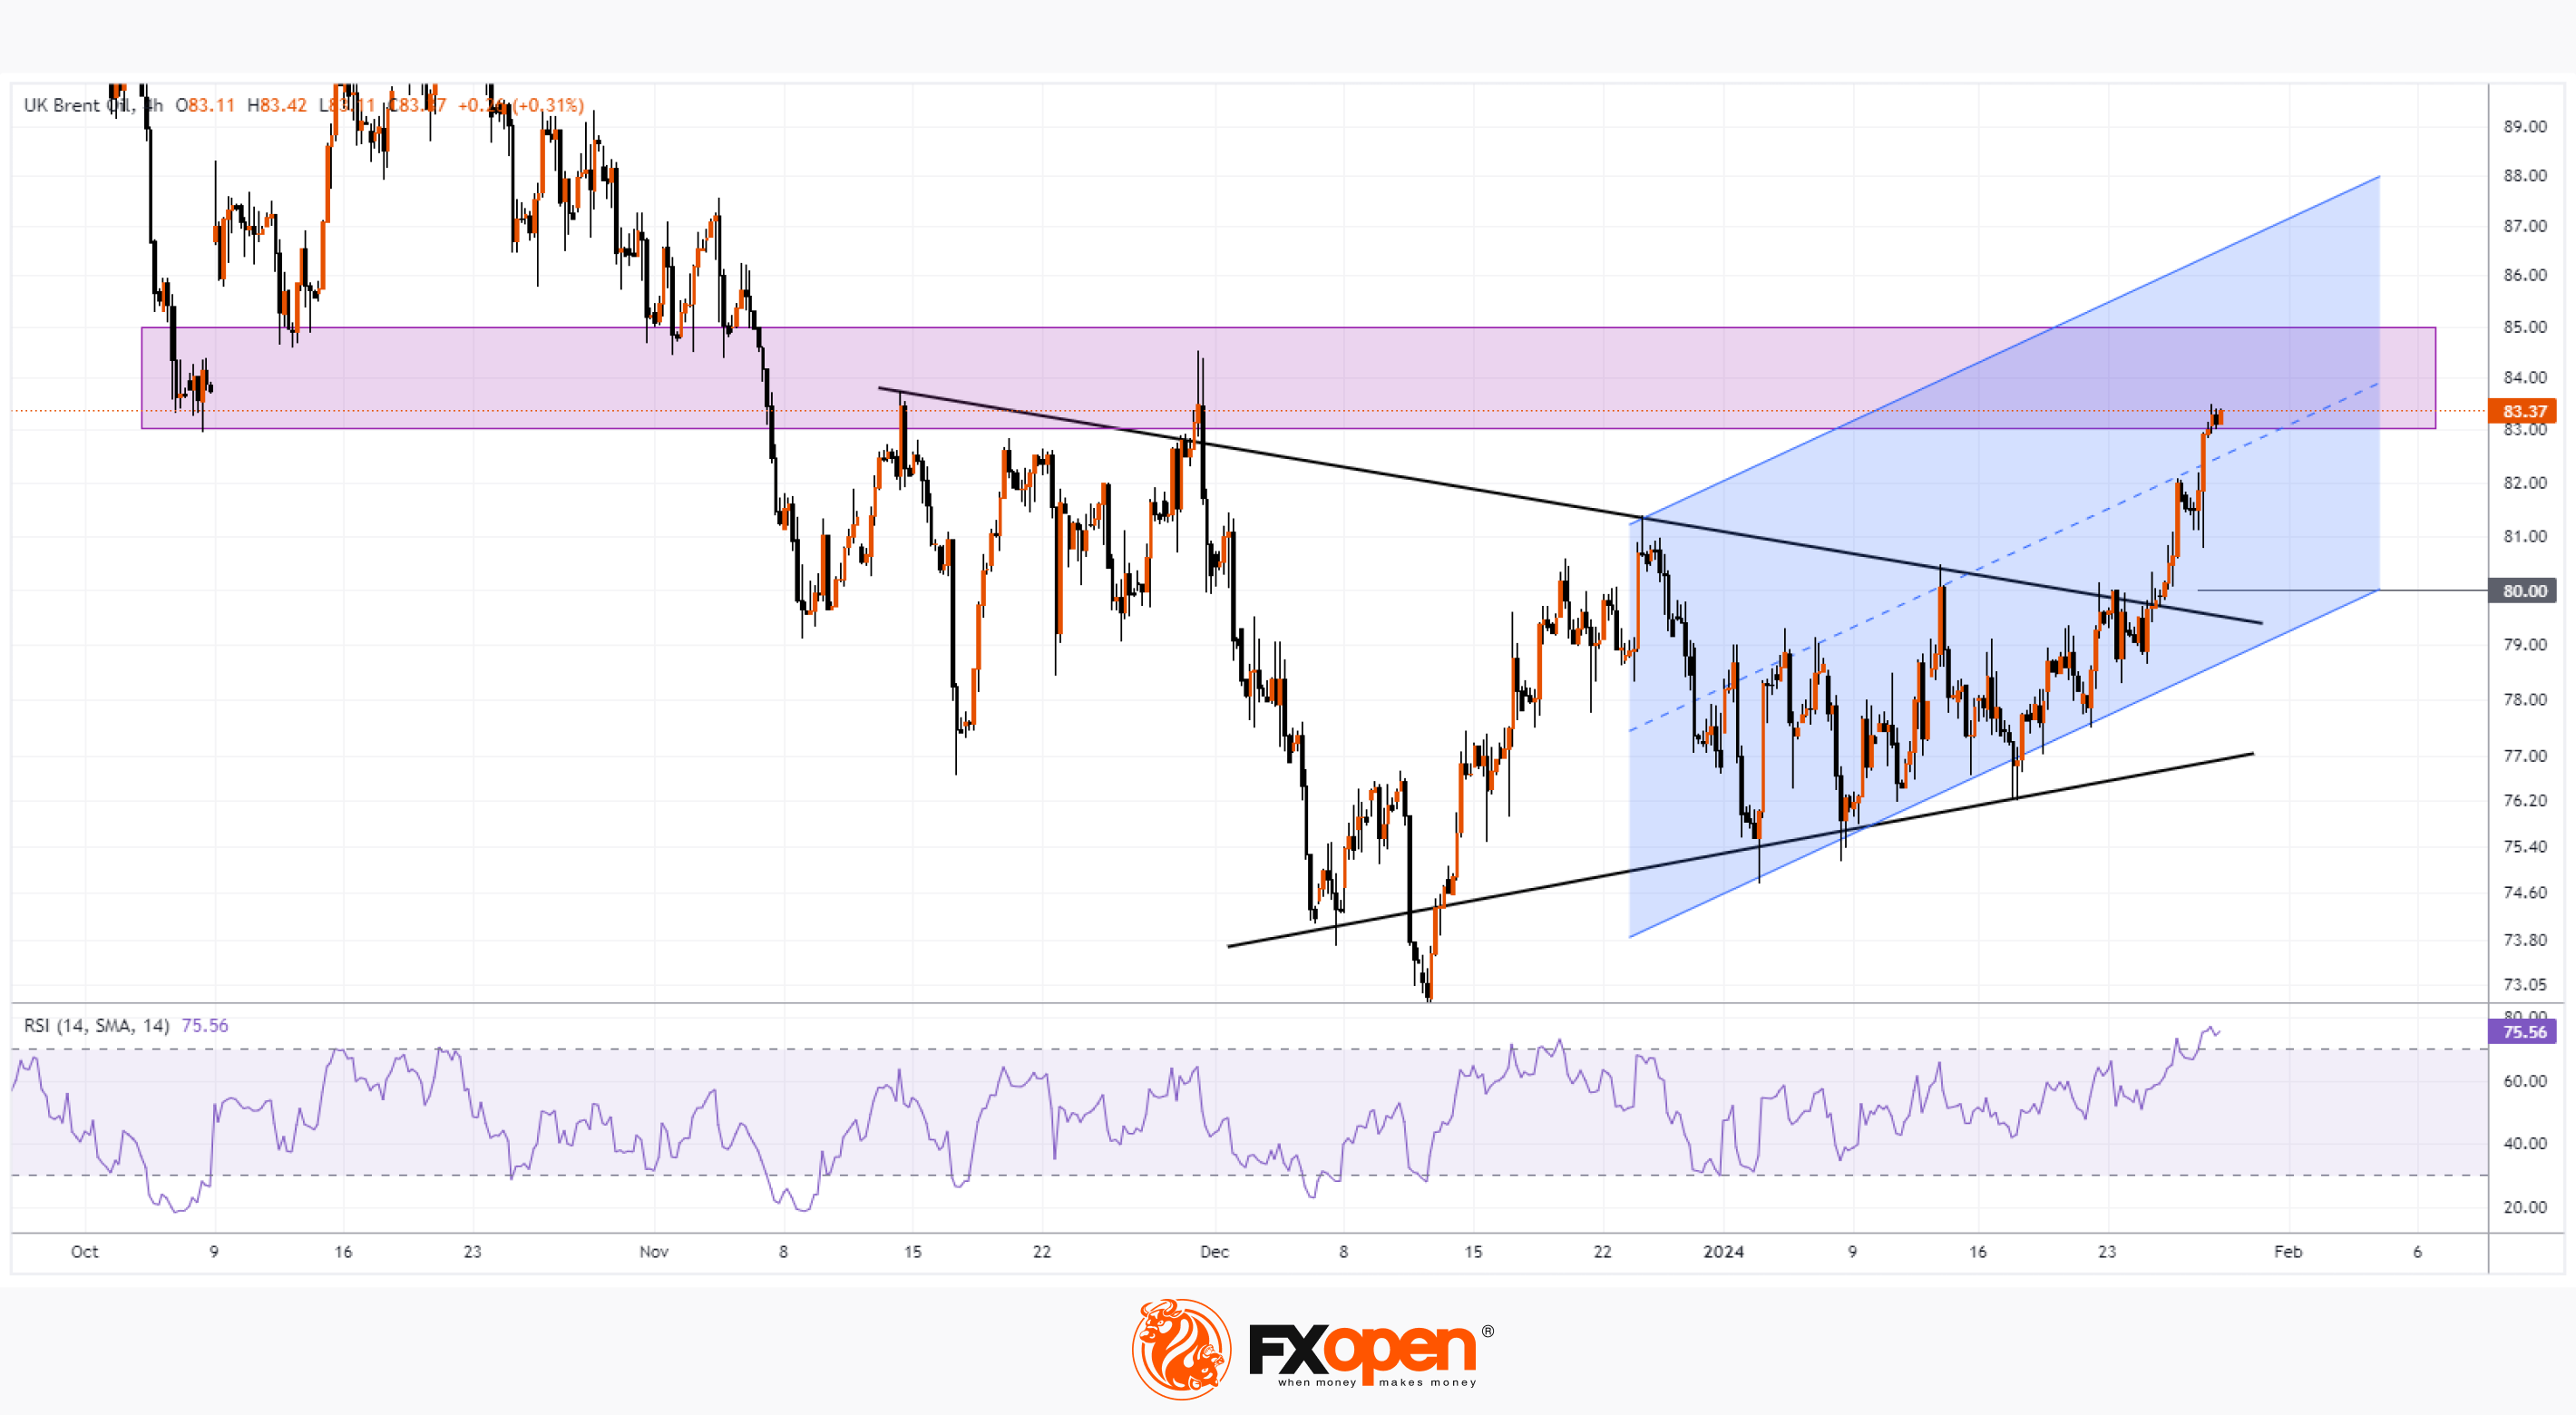
The Brent crude oil chart today shows that:
→ The price strengthened higher than the zone of consolidation (shown by narrowing black lines), having completed its bullish break at the psychological level of 80 US dollars per barrel.
→ The price forms an ascending channel (shown in blue).
→ The price rose to the USD 83.00-85.00 zone, which previously served as a support area, but changed its role in November.
→ The market is overbought, judging by the readings of the RSI indicator.
If the geopolitical tension increases, then the bulls can try to raise the price of Brent oil through the specified zone - it is possible that it will reach the upper border of the channel.
On the other hand, if the fundamental background indicates a decrease in the degree of threats in the Middle East, the price can form a pullback from the resistance zone so that the RSI drops closer to values around 50.
Start trading commodity CFDs with tight spreads (additional fees may apply). Open your trading account now or learn more about trading commodity CFDs with FXOpen.
This article represents the opinion of the Companies operating under the FXOpen brand only. It is not to be construed as an offer, solicitation, or recommendation with respect to products and services provided by the Companies operating under the FXOpen brand, nor is it to be considered financial advice.
Stay ahead of the market!
Subscribe now to our mailing list and receive the latest market news and insights delivered directly to your inbox.


Latest articles

Apple: Earnings Day Above the Activity Zone
On 30 April, after the market close, Apple Inc. will release its financial results for the second quarter of fiscal 2026. The consensus forecast, based on estimates from 31 analysts, points to revenue of around $109.7 billion, with expected

USD/JPY and USD/CHF Near Key Levels: The Dollar Supported by the Fed
The US dollar continues to trend upwards following the Federal Reserve meeting, drawing support from the regulator’s moderately hawkish stance and comments by Jerome Powell. Markets interpret the Fed’s rhetoric as a signal that restrictive policy is likely

EUR/USD and GBP/USD consolidate ahead of the Fed decision
European currencies are showing subdued dynamics, entering a consolidation phase following their previous advance. Earlier, EUR/USD and GBP/USD broke out of their ranges and strengthened; however, the subsequent correction has led both pairs to retest the previously breached