FXOpen

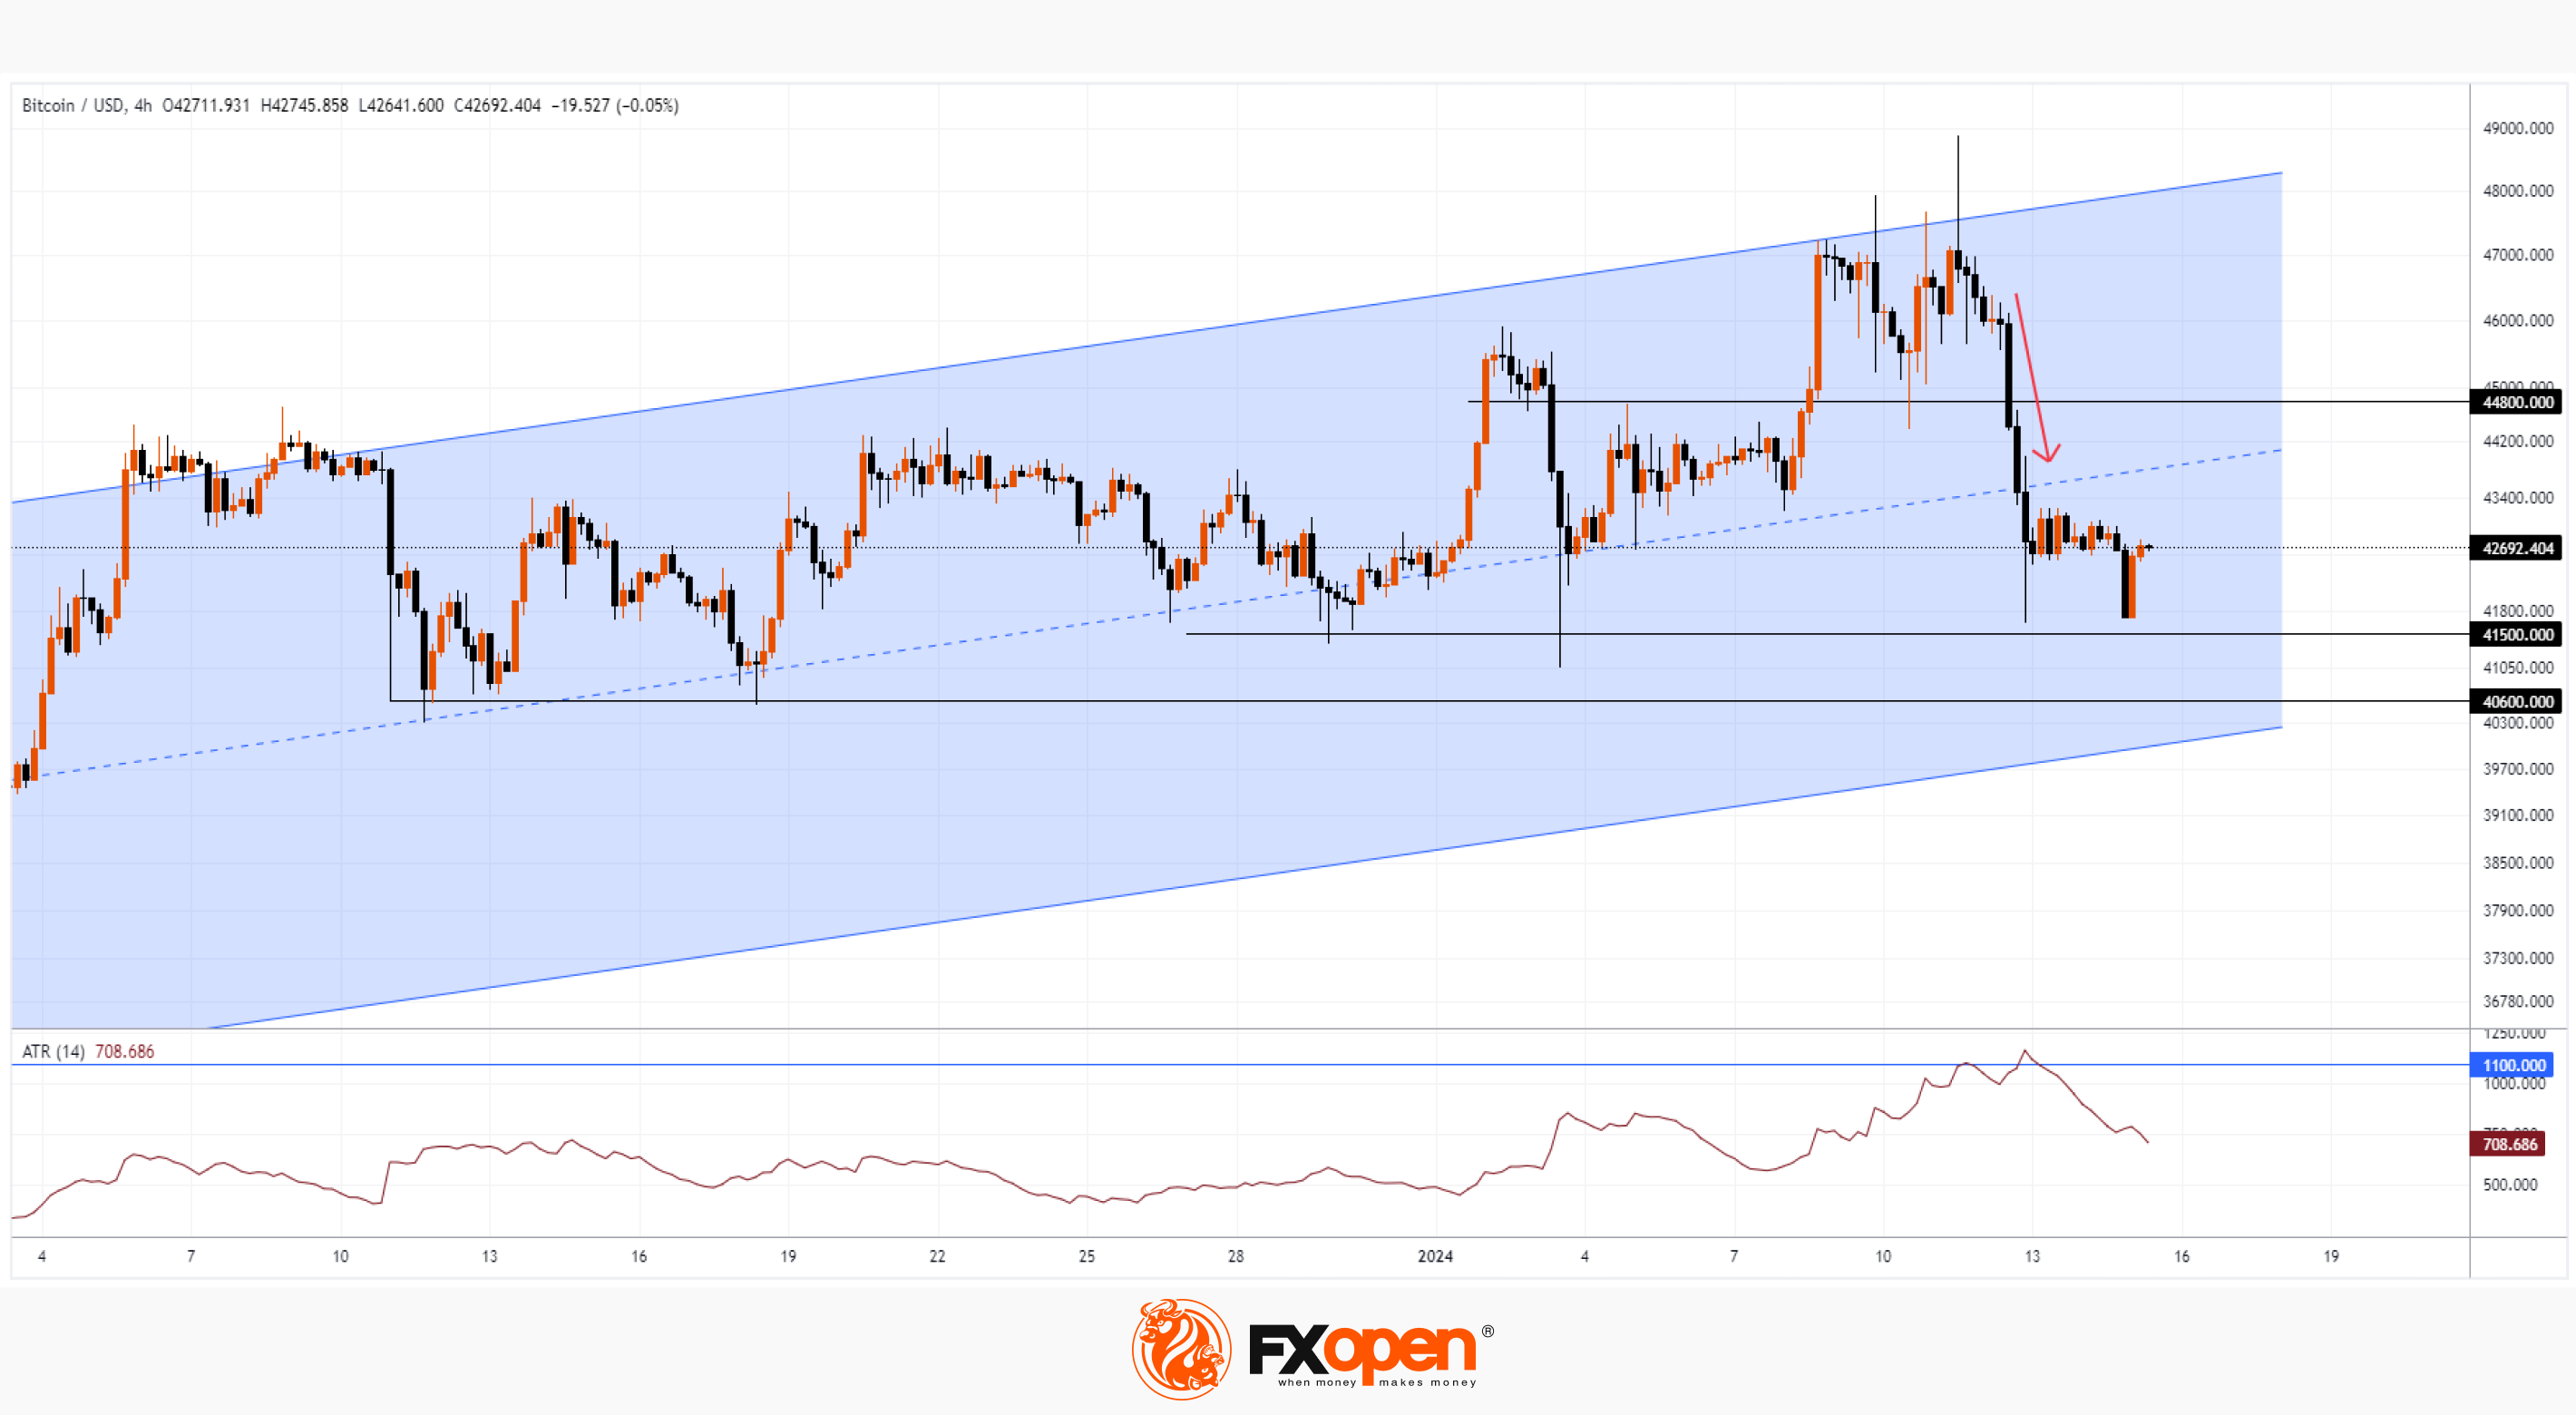
On January 11, the highly publicized Bitcoin ETF began trading after it was officially approved by the SEC. On this day, the price of Bitcoin exceeded USD 48,800, as shown by the chart. Bloomberg writes that new US spot funds achieved net inflows of USD 819 million in the first two days of trading.
However, from the high on January 11, a dizzying fall began, and already at the low on January 12, Bitcoin was worth less than USD 41,800. This dynamic may illustrate the “buy the rumors, sell the facts” strategy, which we wrote about on January 3 when predicting the price of Bitcoin in 2024.
News of the ETF's approval sent the ATR above 1,100 on the 4-hour chart, the last time it did so was in mid-June 2022. The market was overly active, and what is important is that three bearish candles (marked with an arrow) summed up this activity. They can be interpreted as the three black crows pattern.
According to statistics from Tim Bulkowski, this pattern works in 78% of cases and means a trend change from bullish to bearish. According to CandleScanner statistics for 20 years, collected on the S&P 500 index market, the pattern turned out to be false only in 18.6% of cases out of 543 occurrences.
Does this mean that the statistics will work on the Bitcoin price chart?

So far, the price is still within the bullish trend (shown as a channel).
The nearest support levels: 41,500, 40,600, the lower border of the channel.
The nearest resistance levels: 44,800, the median line of the channel.
Let’s assume that the beginning of the week will show a continued influx of capital into the Bitcoin ETF. At the same time, it is possible that the price will form a rebound from one of the support lines. But what if these investors also fall into the trap that those who bought Bitcoin on January 11-12 are now in? Then we may witness a breakdown of the lower border of the blue channel, which will confirm the importance of the three black crows pattern.
FXOpen offers the world's most popular cryptocurrency CFDs*, including Bitcoin and Ethereum. Floating spreads, 1:2 leverage — at your service. Open your trading account now or learn more about crypto CFD trading with FXOpen.
*At FXOpen UK and FXOpen AU, Cryptocurrency CFDs are only available for trading by those clients categorised as Professional clients under FCA Rules and Professional clients under ASIC Rules respectively. They are not available for trading by Retail clients.
This article represents the opinion of the Companies operating under the FXOpen brand only. It is not to be construed as an offer, solicitation, or recommendation with respect to products and services provided by the Companies operating under the FXOpen brand, nor is it to be considered financial advice.
Stay ahead of the market!
Subscribe now to our mailing list and receive the latest market news and insights delivered directly to your inbox.


