


Fundamental Analysis on April 18, 2023: Abnormal Balance in Energy Markets
FXOpen

The cost of oil futures on the NYMEX exchange at the beginning of the week is $82.48. Gas futures price on the same exchange at the same moment is $2.15. The ratio of oil to gas contracts is 38.36 ($82.48 / $2.15). And on Friday, it was above 40 — the last time such a proportion was in May 2012.
For many years, the oil/gas ratio has not exceeded 25-30. But a mild winter in the US, which pushed down gas prices, plus the recent OPEC+ decision on oil production caps, have all pushed the ratio to an anomaly. But it looks like it may be back to more familiar levels as the daily natural gas price chart sends two bullish signals:
1 → false bearish breakdown of the low of the year;
2 → bullish gap at the week open.
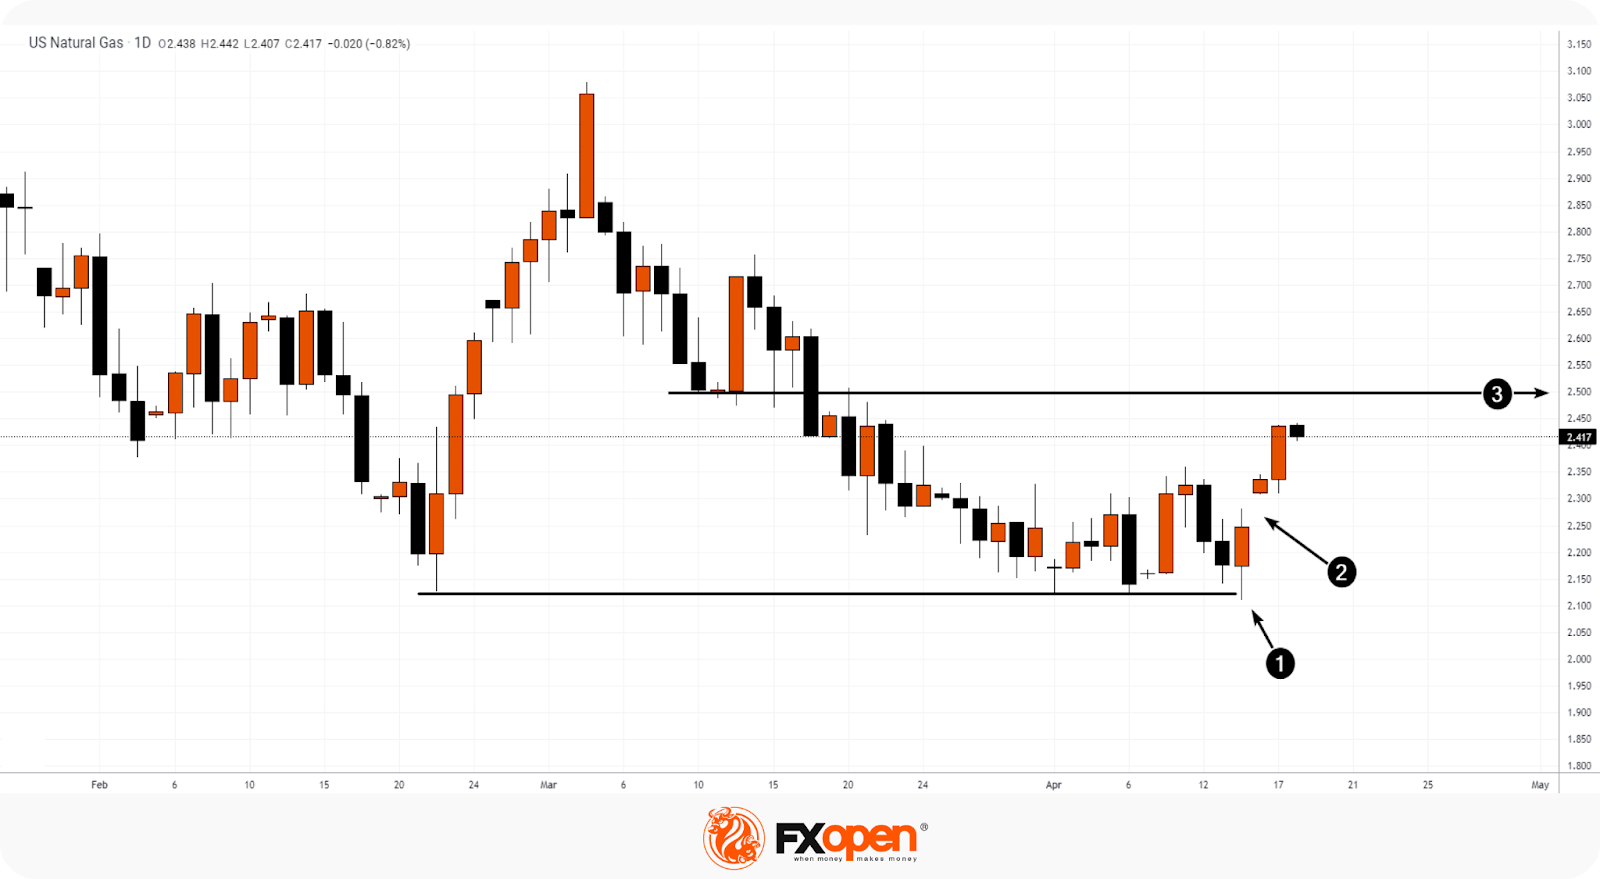
The last two long bullish candles indicate that demand is dominating. It is possible that the price may reach the psychological (3) level of $2.5 (which served as both support and resistance in March) and continue to grow — we recall that according to the forecast of the US Energy Information Administration, the gas price for 2023 should be $3.13 (almost +40% from current values).
This forecast represents FXOpen Companies opinion only, it should not be construed as an offer, invitation or recommendation in respect of FXOpen Companies products and services or as financial advice.
Start trading commodity CFDs with tight spreads (additional fees may apply). Open your trading account now or learn more about trading commodity CFDs with FXOpen.
This article represents the opinion of the Companies operating under the FXOpen brand only. It is not to be construed as an offer, solicitation, or recommendation with respect to products and services provided by the Companies operating under the FXOpen brand, nor is it to be considered financial advice.
Stay ahead of the market!
Subscribe now to our mailing list and receive the latest market news and insights delivered directly to your inbox.


Latest articles

DAX 40: consolidation amid technology sell-off
A wave of selling in the technology sector that emerged earlier this week has weighed on European equities. The trigger was investor concern over the profitability of large-scale debt-funded investments by major US tech companies in AI infrastructure. The Nasdaq

Euro Hits Fresh Yearly Lows Amid Dovish ECB Signals
The euro remains under pressure following weak macroeconomic data from the euro area and fresh signals that the European Central Bank is prepared to maintain a more accommodative monetary policy stance. Data released yesterday pointed to a deterioration in business

Pound at Key Levels: Markets Assess Impact of Political Uncertainty in the UK
The British pound remains under pressure following increased political uncertainty in the United Kingdom triggered by the Prime Minister’s resignation. Investors are assessing potential shifts in the political and economic policy outlook after the head of government stepped down,