


Gold Price Analysis: Bulls Are Missing Out Again
FXOpen

Kitco is relaying an opinion on the price of gold from Karen Karniol-Tambour, co-chief investment officer at Bridgewater Associates:
→ Gold is undervalued.
→ Gold is supported by the tense geopolitical situation, including the military operations in Ukraine.
→ Inflation is volatile. There is a possibility that purchasing power will be lost.
It looks like a positive assessment should be taken as a long-term perspective, because so far the XAU/USD gold price chart shows a bearish trend.
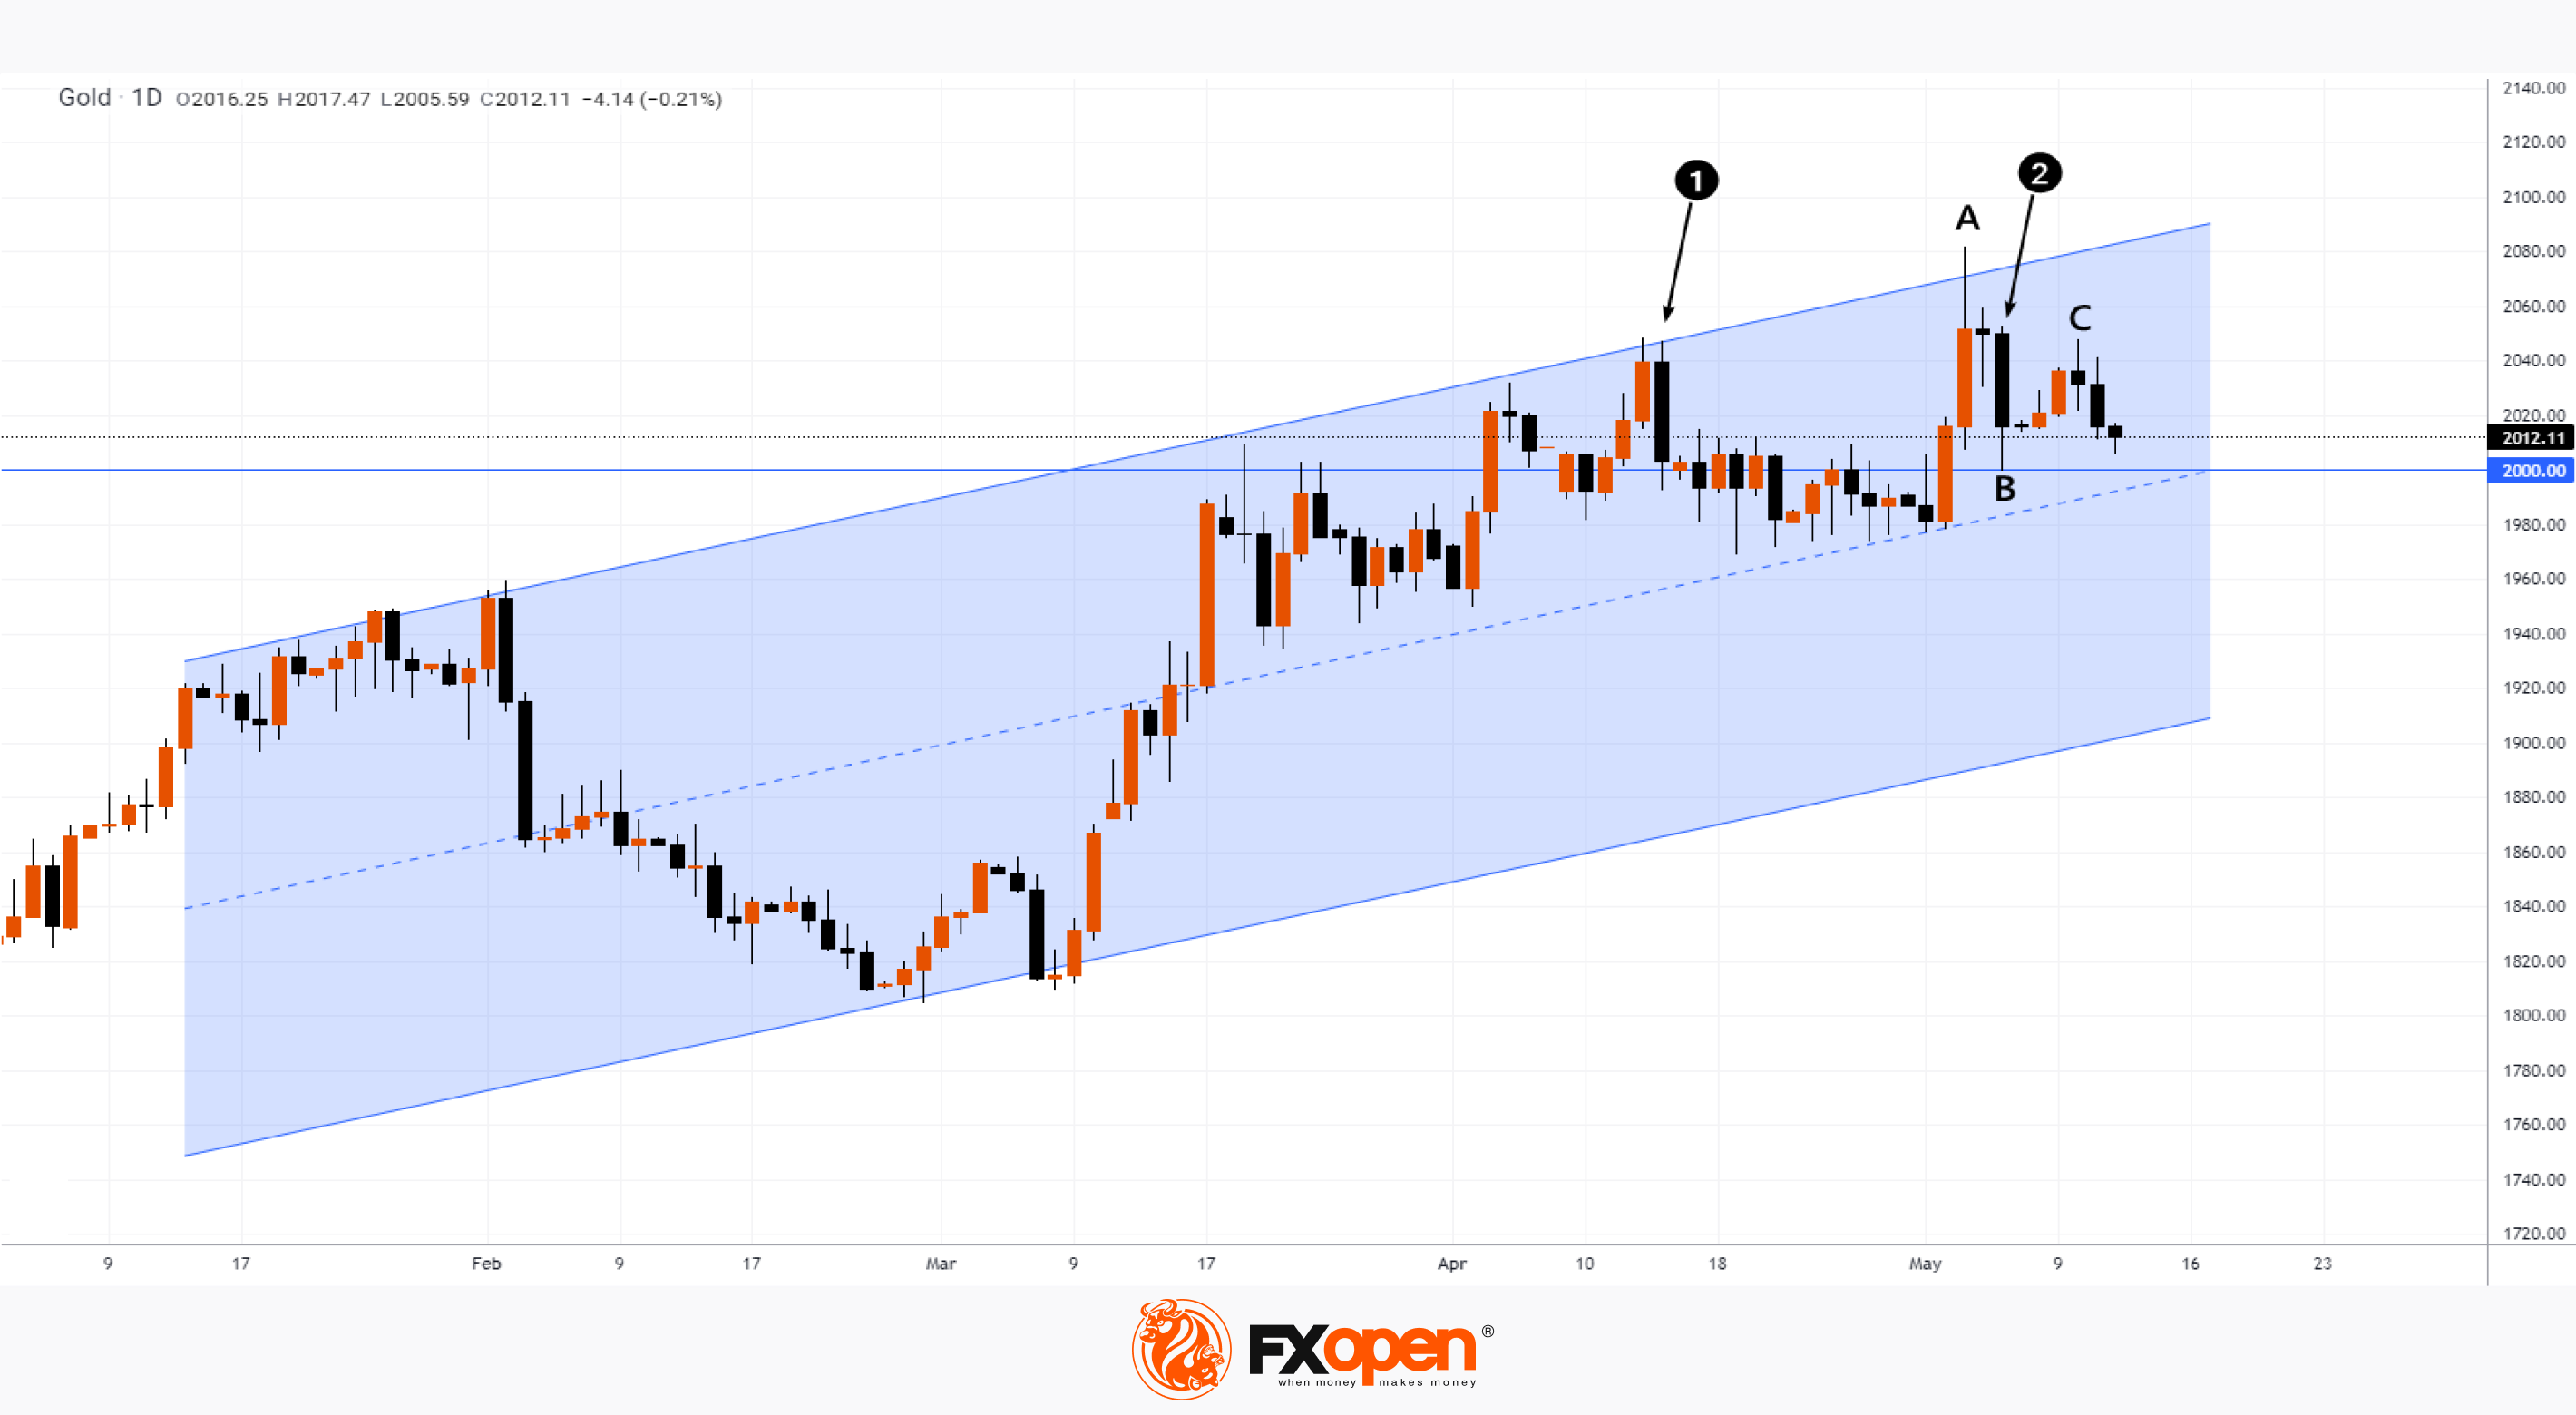
In April-May 2023, the price of XAU/USD exceeded the level of USD 2,000 for the third time (the first was in the summer of 2020, the second in the spring of 2022). But, judging by the analysis of the chart, this time the bulls will not be able to stay above this psychological mark.
→ On candles 1 and 2 bears are powerfully absorbing bullish efforts.
→ A long upper shadow on May 4 (A) indicates a lot of supply.
→ The rebound in B→C is approximately 50% of the decline in A→B
Therefore, there is a growing possibility that the price of gold XAU/USD may fall to the lower border of the current channel (shown in blue).
This article represents the opinion of the Companies operating under the FXOpen brand only. It is not to be construed as an offer, solicitation, or recommendation with respect to products and services provided by the Companies operating under the FXOpen brand, nor is it to be considered financial advice.
Start trading commodity CFDs with tight spreads (additional fees may apply). Open your trading account now or learn more about trading commodity CFDs with FXOpen.
This article represents the opinion of the Companies operating under the FXOpen brand only. It is not to be construed as an offer, solicitation, or recommendation with respect to products and services provided by the Companies operating under the FXOpen brand, nor is it to be considered financial advice.
Stay ahead of the market!
Subscribe now to our mailing list and receive the latest market news and insights delivered directly to your inbox.


Latest articles

USD/JPY and USD/CHF Near Key Levels: The Dollar Supported by the Fed
The US dollar continues to trend upwards following the Federal Reserve meeting, drawing support from the regulator’s moderately hawkish stance and comments by Jerome Powell. Markets interpret the Fed’s rhetoric as a signal that restrictive policy is likely

EUR/USD and GBP/USD consolidate ahead of the Fed decision
European currencies are showing subdued dynamics, entering a consolidation phase following their previous advance. Earlier, EUR/USD and GBP/USD broke out of their ranges and strengthened; however, the subsequent correction has led both pairs to retest the previously breached

Meta: V-Shaped Recovery Meets Heavy Volume Resistance
The movement in Meta Platforms shares is being driven by two competing narratives. On one hand, advertising revenue is benefiting from AI-based tools: the Advantage+ platform continues to support strong advertiser demand, and the analyst consensus for Q1 2026 revenue