


In One Session, Price of Gold Rose by Approximately $60
FXOpen

The opening price on Friday was around 1,870, the closing price was around 1,930. The reason for the rapid growth of the XAU/USD quote is geopolitical tension. Israeli forces announced a ground operation in the Gaza Strip, which may be why before the weekend the markets were dominated by the forces of demand for gold as a defensive asset.
The Chinese Foreign Ministry said Israel's actions went beyond self-defense. And the famous investor Ray Dalio expressed the opinion that the risk of global war is 50% due to the situation in the Middle East.
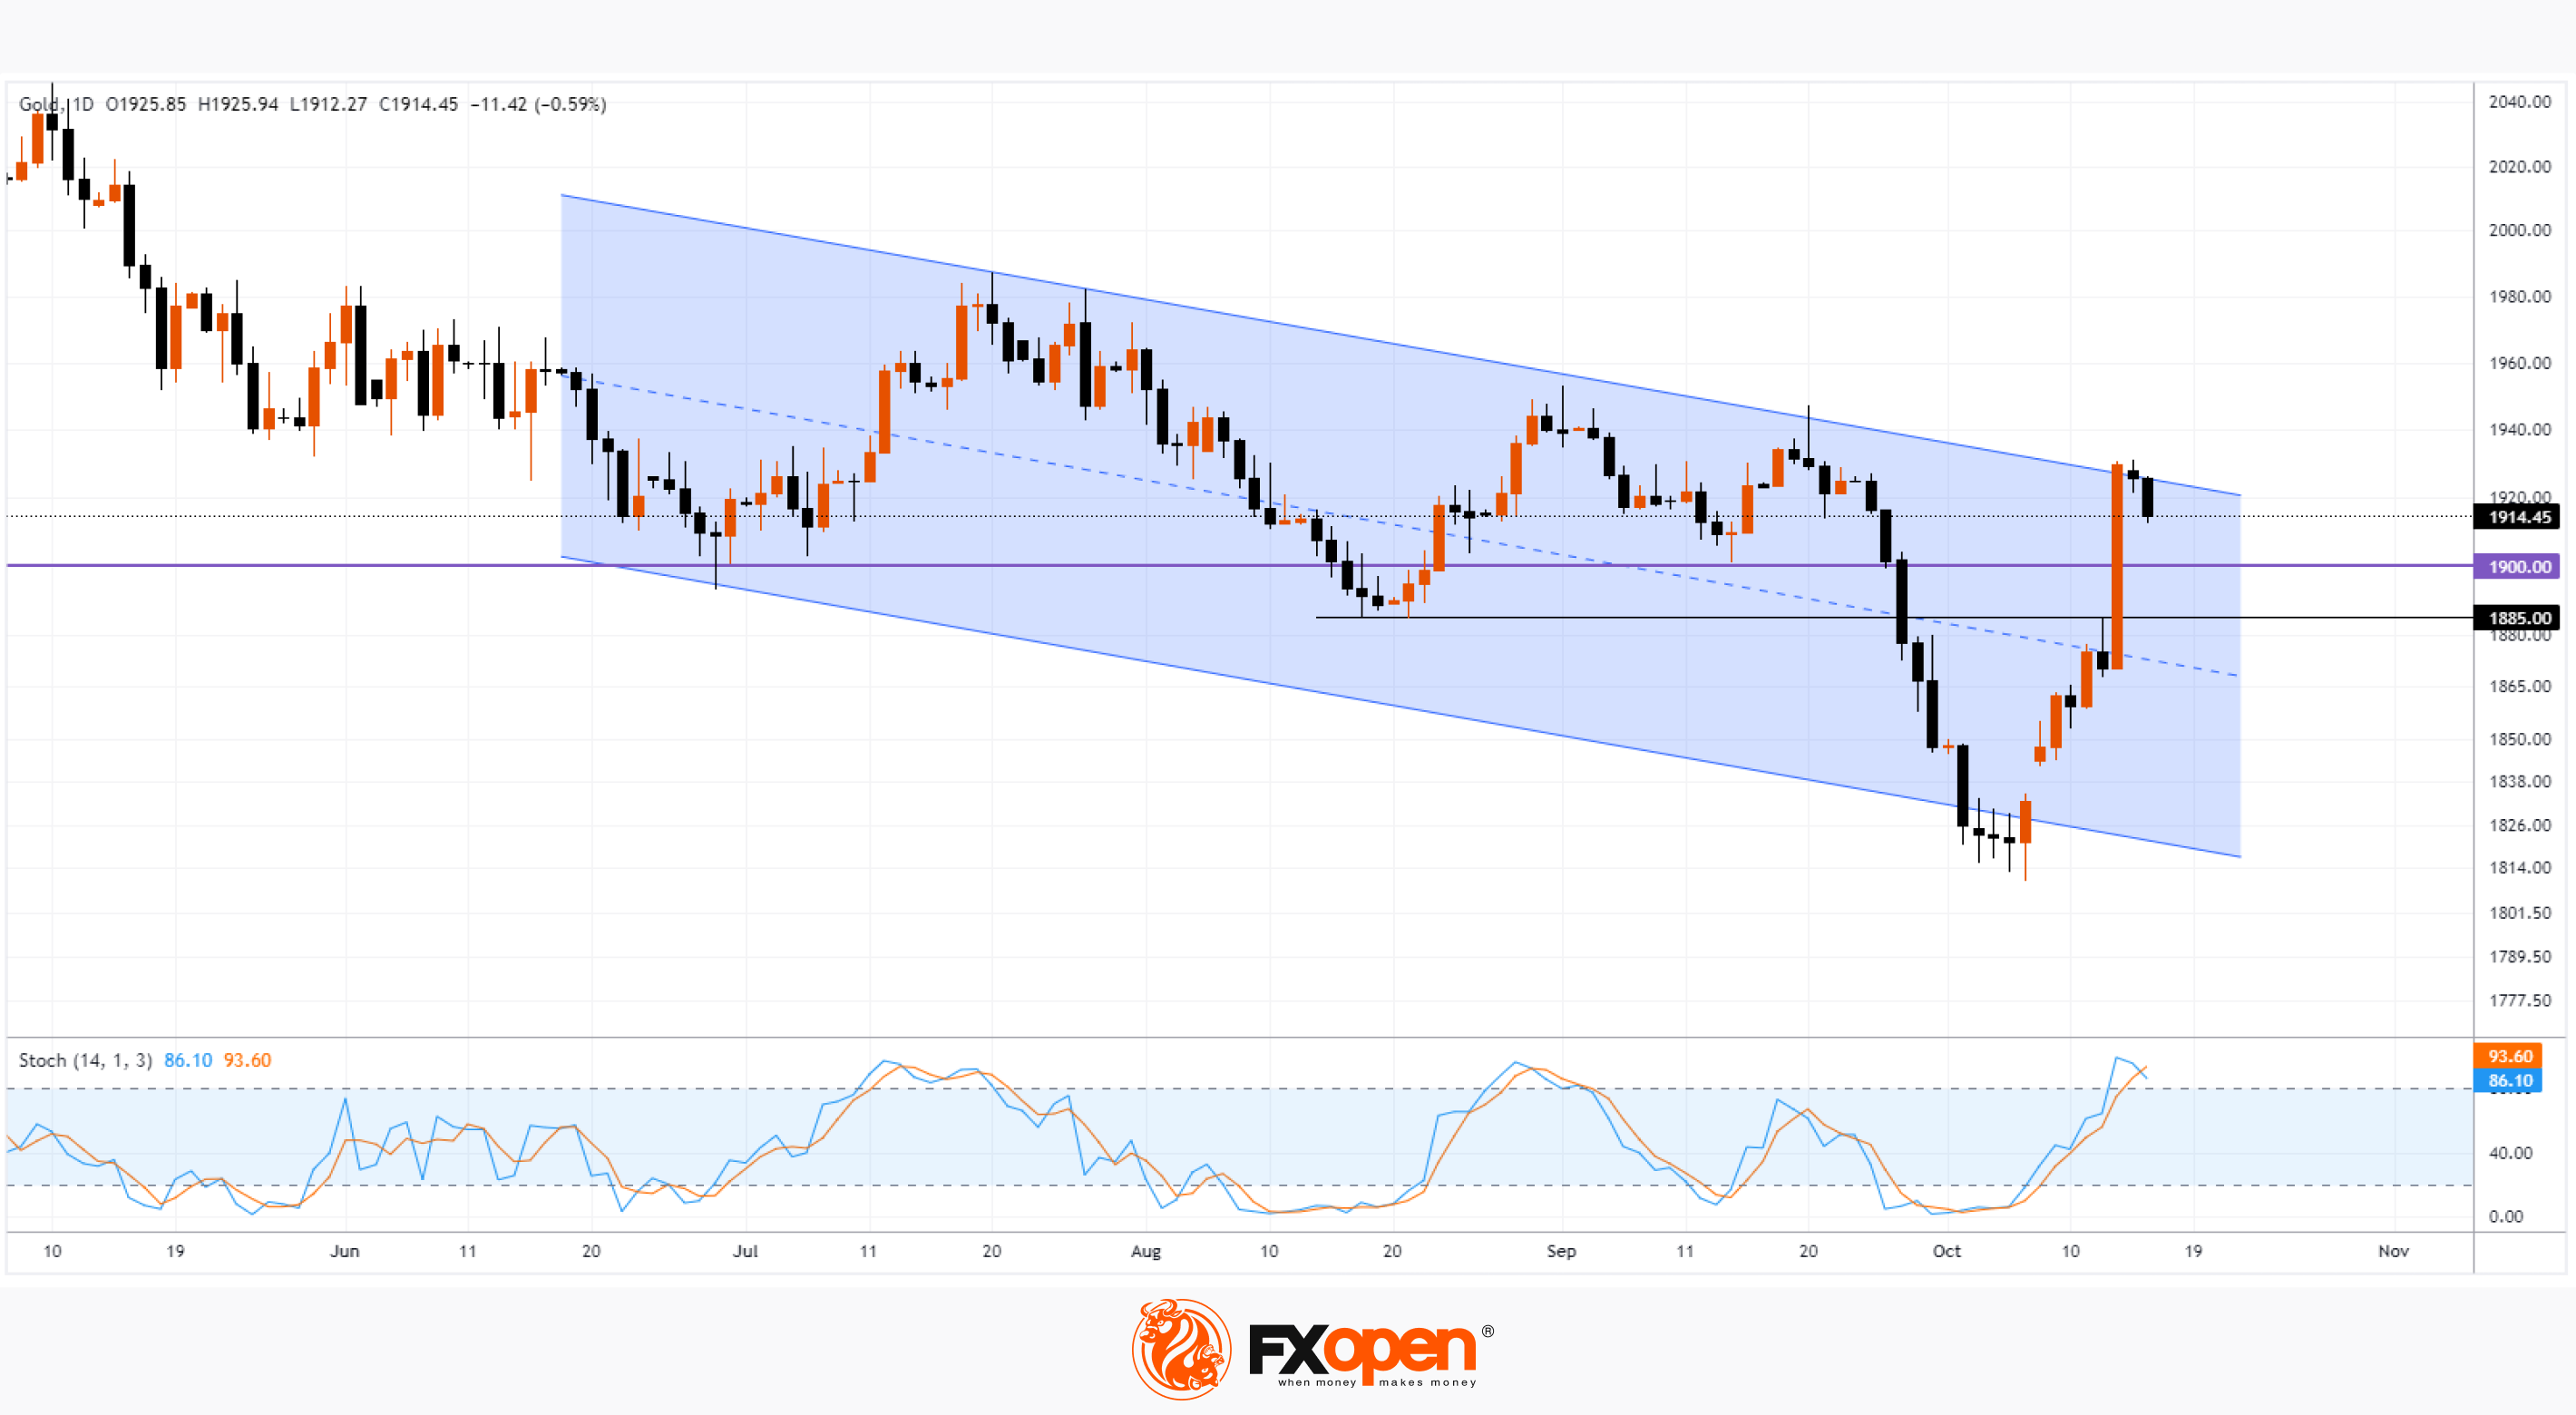
The XAU/USD chart shows that the price of gold has reached the upper limit of the downward channel.
Technically:
→ the price of gold may encounter resistance from the upper border;
→ the price may roll back from the overbought zone, which is indicated by the stochastic oscillator;
→ the price may be supported by the psychological level of 1,900;
→ support may be provided by the level of 1,885; previously the price formed reversals from it.
However, the main driver of the price of gold will likely remain the fundamental factor. Steps aimed at resolving the military conflict will help ensure that the price of gold remains within the descending channel that has been in effect since the first half of the year.
Start trading commodity CFDs with tight spreads (additional fees may apply). Open your trading account now or learn more about trading commodity CFDs with FXOpen.
This article represents the opinion of the Companies operating under the FXOpen brand only. It is not to be construed as an offer, solicitation, or recommendation with respect to products and services provided by the Companies operating under the FXOpen brand, nor is it to be considered financial advice.
Stay ahead of the market!
Subscribe now to our mailing list and receive the latest market news and insights delivered directly to your inbox.


Latest articles

AI Valuations Are Back in the Spotlight
Artificial intelligence remains the dominant investment theme of 2026, but investors are increasingly questioning whether AI stock valuations are keeping pace with reality.
💰 Big Tech continues to invest at an unprecedented scale, with hyperscaler AI spending projected to exceed $800

AUD/CAD: Months of Indecision — Is a Breakout Finally Coming?
The Australian dollar has clawed back most of its end-of-June losses, when it touched three-month lows against the greenback amid escalating Middle East tensions. Since then, sentiment has improved: the RBA's Assistant Governor Sarah Hunter signalled the board stands ready

USD/JPY: Battling at the Top of the Triangle
On 3 July, Japan's Finance Minister, Satsuki Katayama, stated that the Ministry of Finance remains in close contact with US authorities regarding developments in USD/JPY as the yen traded near its weakest level in almost 40 years. Similar verbal