


Market Analysis: Oil Price Stabilizes Near Year's Highs
FXOpen

Last week, the Russian Federation and Saudi Arabia confirmed plans to reduce production by the end of the year, which contributed to an increase in oil prices.
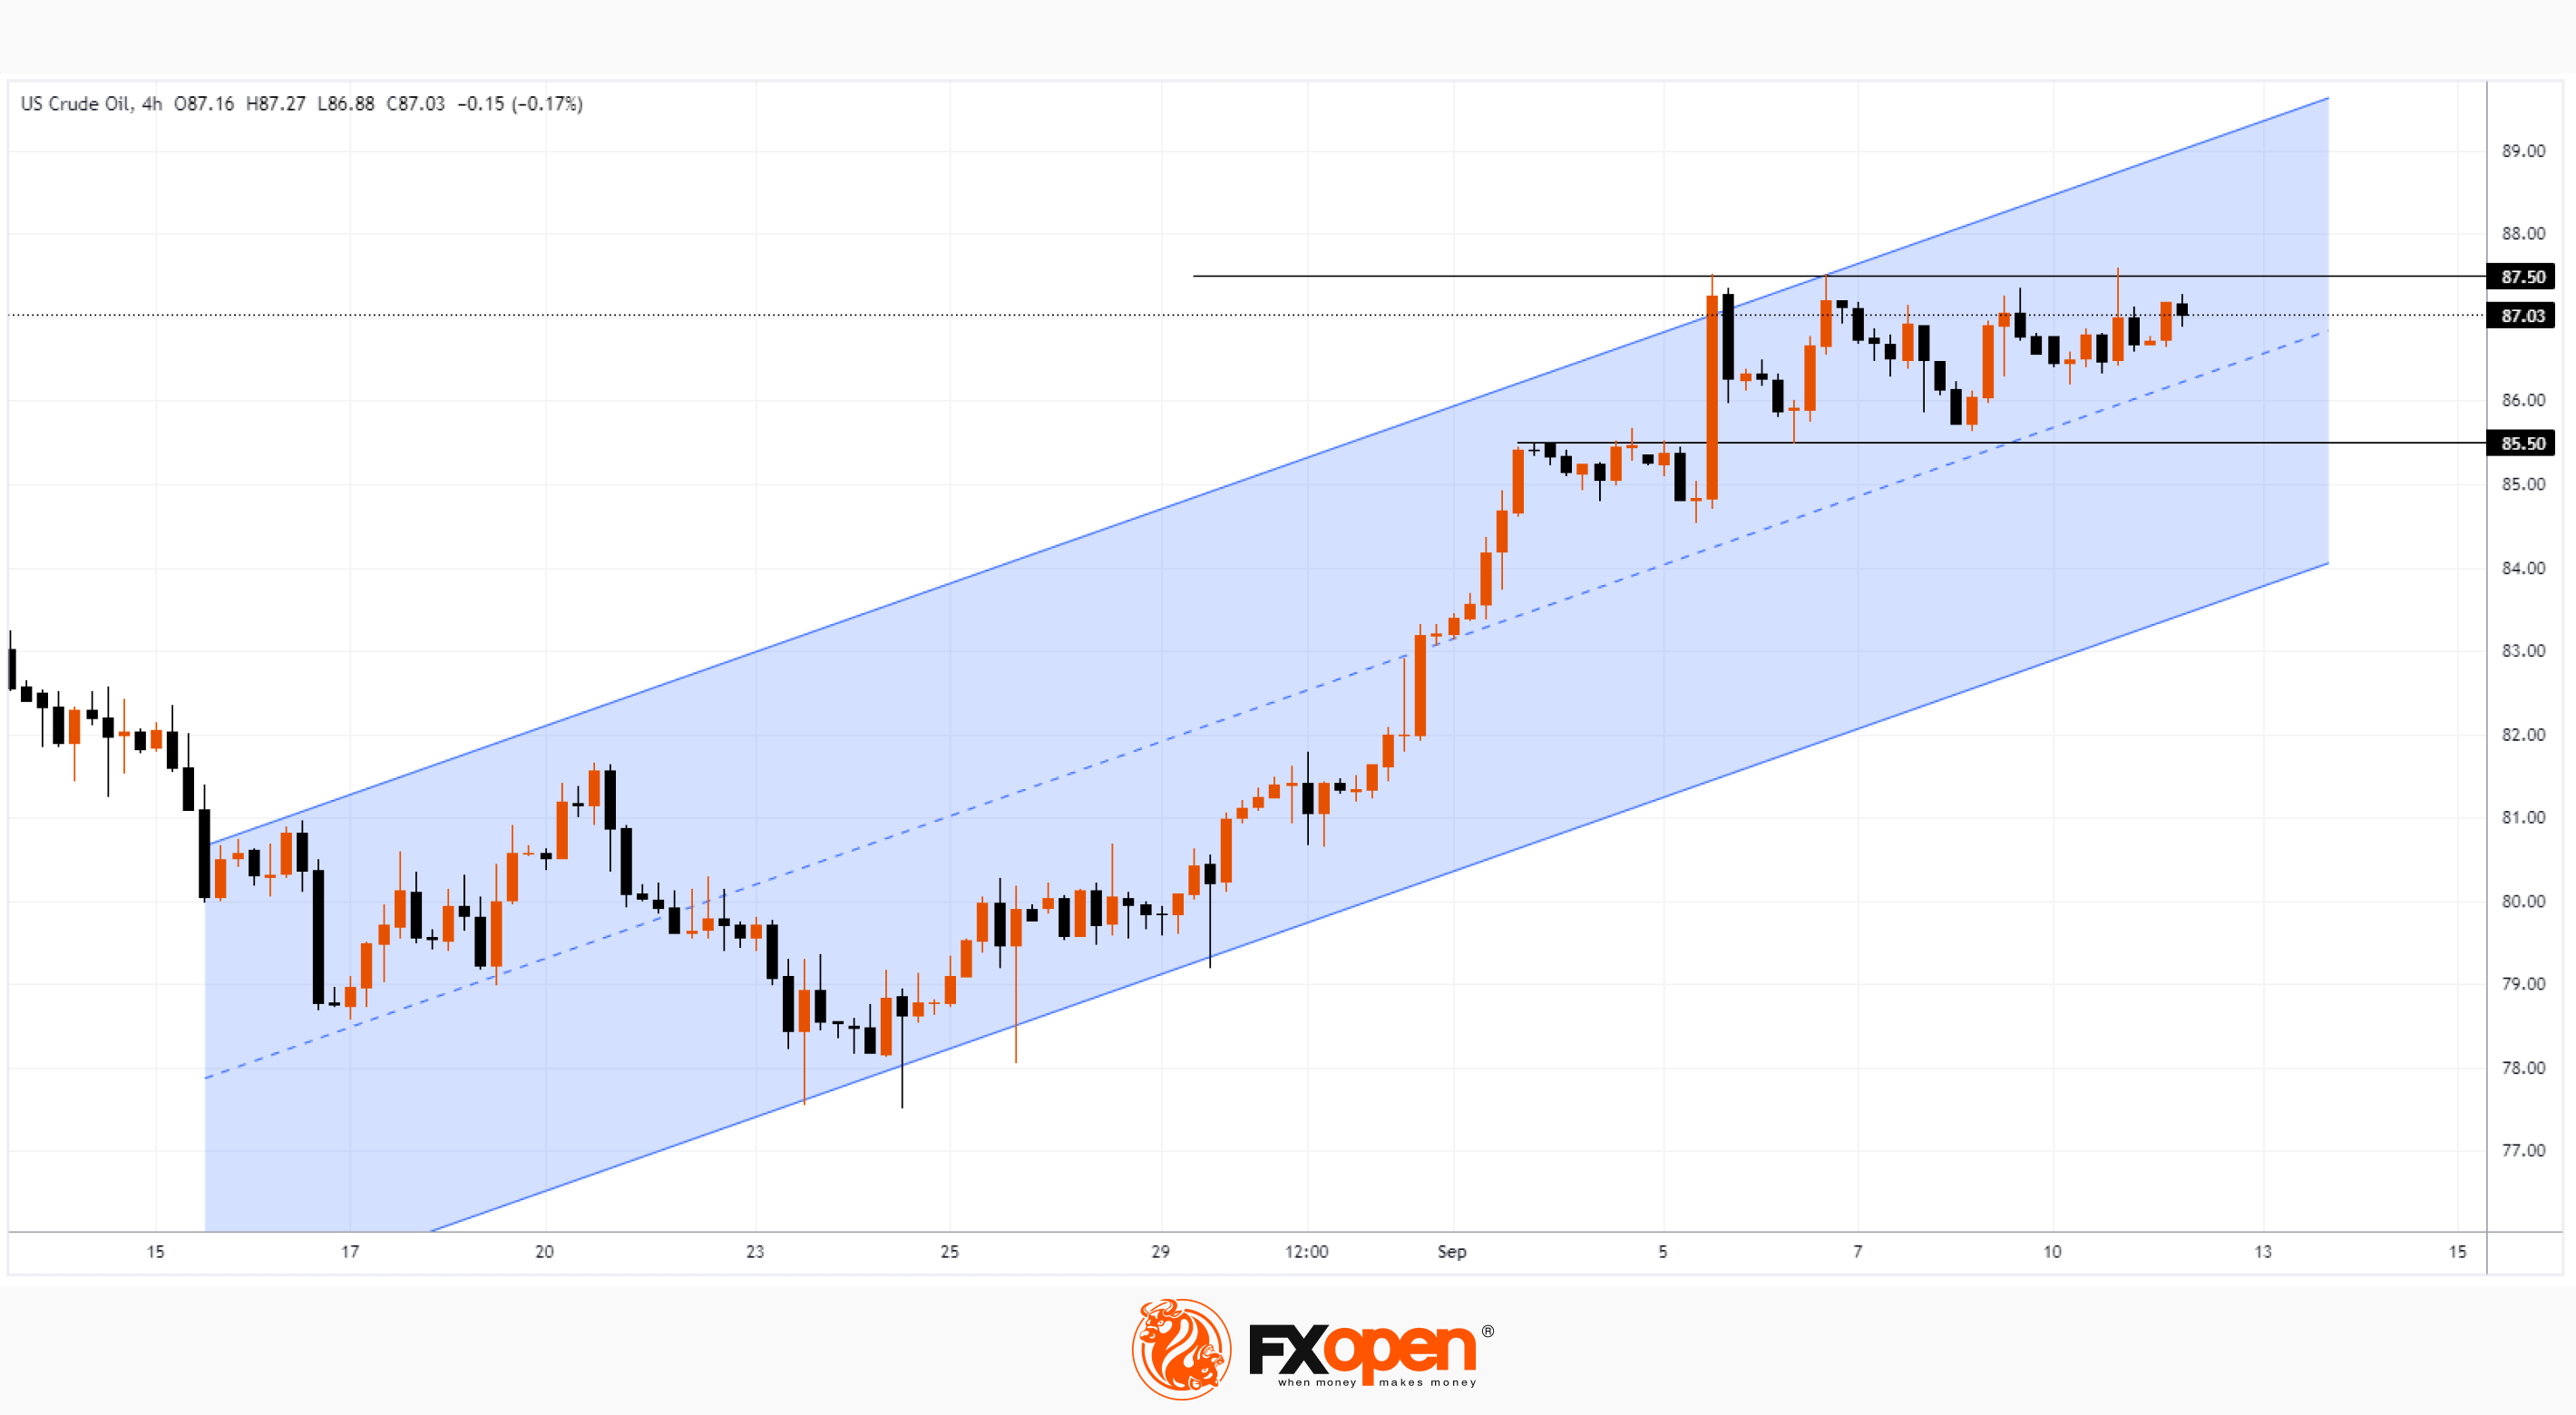
At the beginning of this week, the WTI price stabilized in the range of 85.50 - 87.50. Will the upward trend continue, which will benefit oil producers?
On Tuesday morning, the price is within the triangle formed from the median line of the ascending channel (shown in blue) and the level of 87.50. A breakout of this triangle can occur in both directions.
Bullish arguments:
→ The price is within the ascending channels, both short-term (built on the 1h and 4h charts) and long-term (built on the daily chart).
→ A series of rising lows is forming on the chart, indicating that demand is active.
→ Technically, the market may be supported by the level of 85.50, which previously served as resistance.
→ Oil supplies may be disrupted due to various storms. For example, in eastern Libya, 4 ports were closed due to flooding and a storm, which killed about 2,000 people.
Bearish arguments:
→ News about economic slowdown in various regions (China, Europe) should weaken demand.
→ On September 11, the price of oil renewed its multi-month high, but retreated very quickly. The behavior was similar to a bull trap — a sign of a weak market that could be a harbinger of downward momentum.
→ High oil prices are unprofitable for governments of countries (including the United States) struggling with high inflation.
Tomorrow, at 11:00 GMT+3, the publication of a monthly report on oil prices from the International Energy Agency is scheduled, which could greatly affect the current exchange rate and disrupt the consolidation triangle that is currently in effect.
Start trading commodity CFDs with tight spreads (additional fees may apply). Open your trading account now or learn more about trading commodity CFDs with FXOpen.
This article represents the opinion of the Companies operating under the FXOpen brand only. It is not to be construed as an offer, solicitation, or recommendation with respect to products and services provided by the Companies operating under the FXOpen brand, nor is it to be considered financial advice.
Stay ahead of the market!
Subscribe now to our mailing list and receive the latest market news and insights delivered directly to your inbox.


Latest articles

Weekly Market Insights with Gary Thomson: The Week of Central Banks and Earnings
In this video, we’ll explore the key economic events and market trends, shaping the financial landscape. Get ready for insights into financial markets to help you navigate the week ahead. Let’s dive in!
In this episode of Market

Intel at a Crossroads: Earnings Beat Meets Technical Resistance
Intel has just delivered its strongest quarter in over fifteen years, and the market reaction says it all. Q2 2026 revenue surged 25% year-over-year to $16.1 billion, crushing the consensus estimate of $14.42 billion, while adjusted EPS of

Tesla: Complex Range Structure Breaks Down Following Quarterly Earnings
Tesla released its Q2 2026 results after the market closed on 22 July. Revenue increased 26% year-on-year to $28.24 billion, while vehicle deliveries reached a record 480,126 units. However, operating margin fell sharply to 1.4%, down from