


Market Analysis: Stock Market Reaction to US GDP News
FXOpen

According to data released yesterday, the US economy is growing at a stronger pace than expected. Thus, US GDP in the 3rd quarter increased by 5.3% in annual terms (an increase of 4.9% was expected).
Combined with softening rhetoric from the Federal Reserve, this is a positive signal for US stock markets, which have shown impressive performance: in November, the S&P 500 and Nasdaq Composite indices rose by 8.5% and 11%, respectively (the final figure will be known later, since today – last day of the month), which is the best month since July 2022.
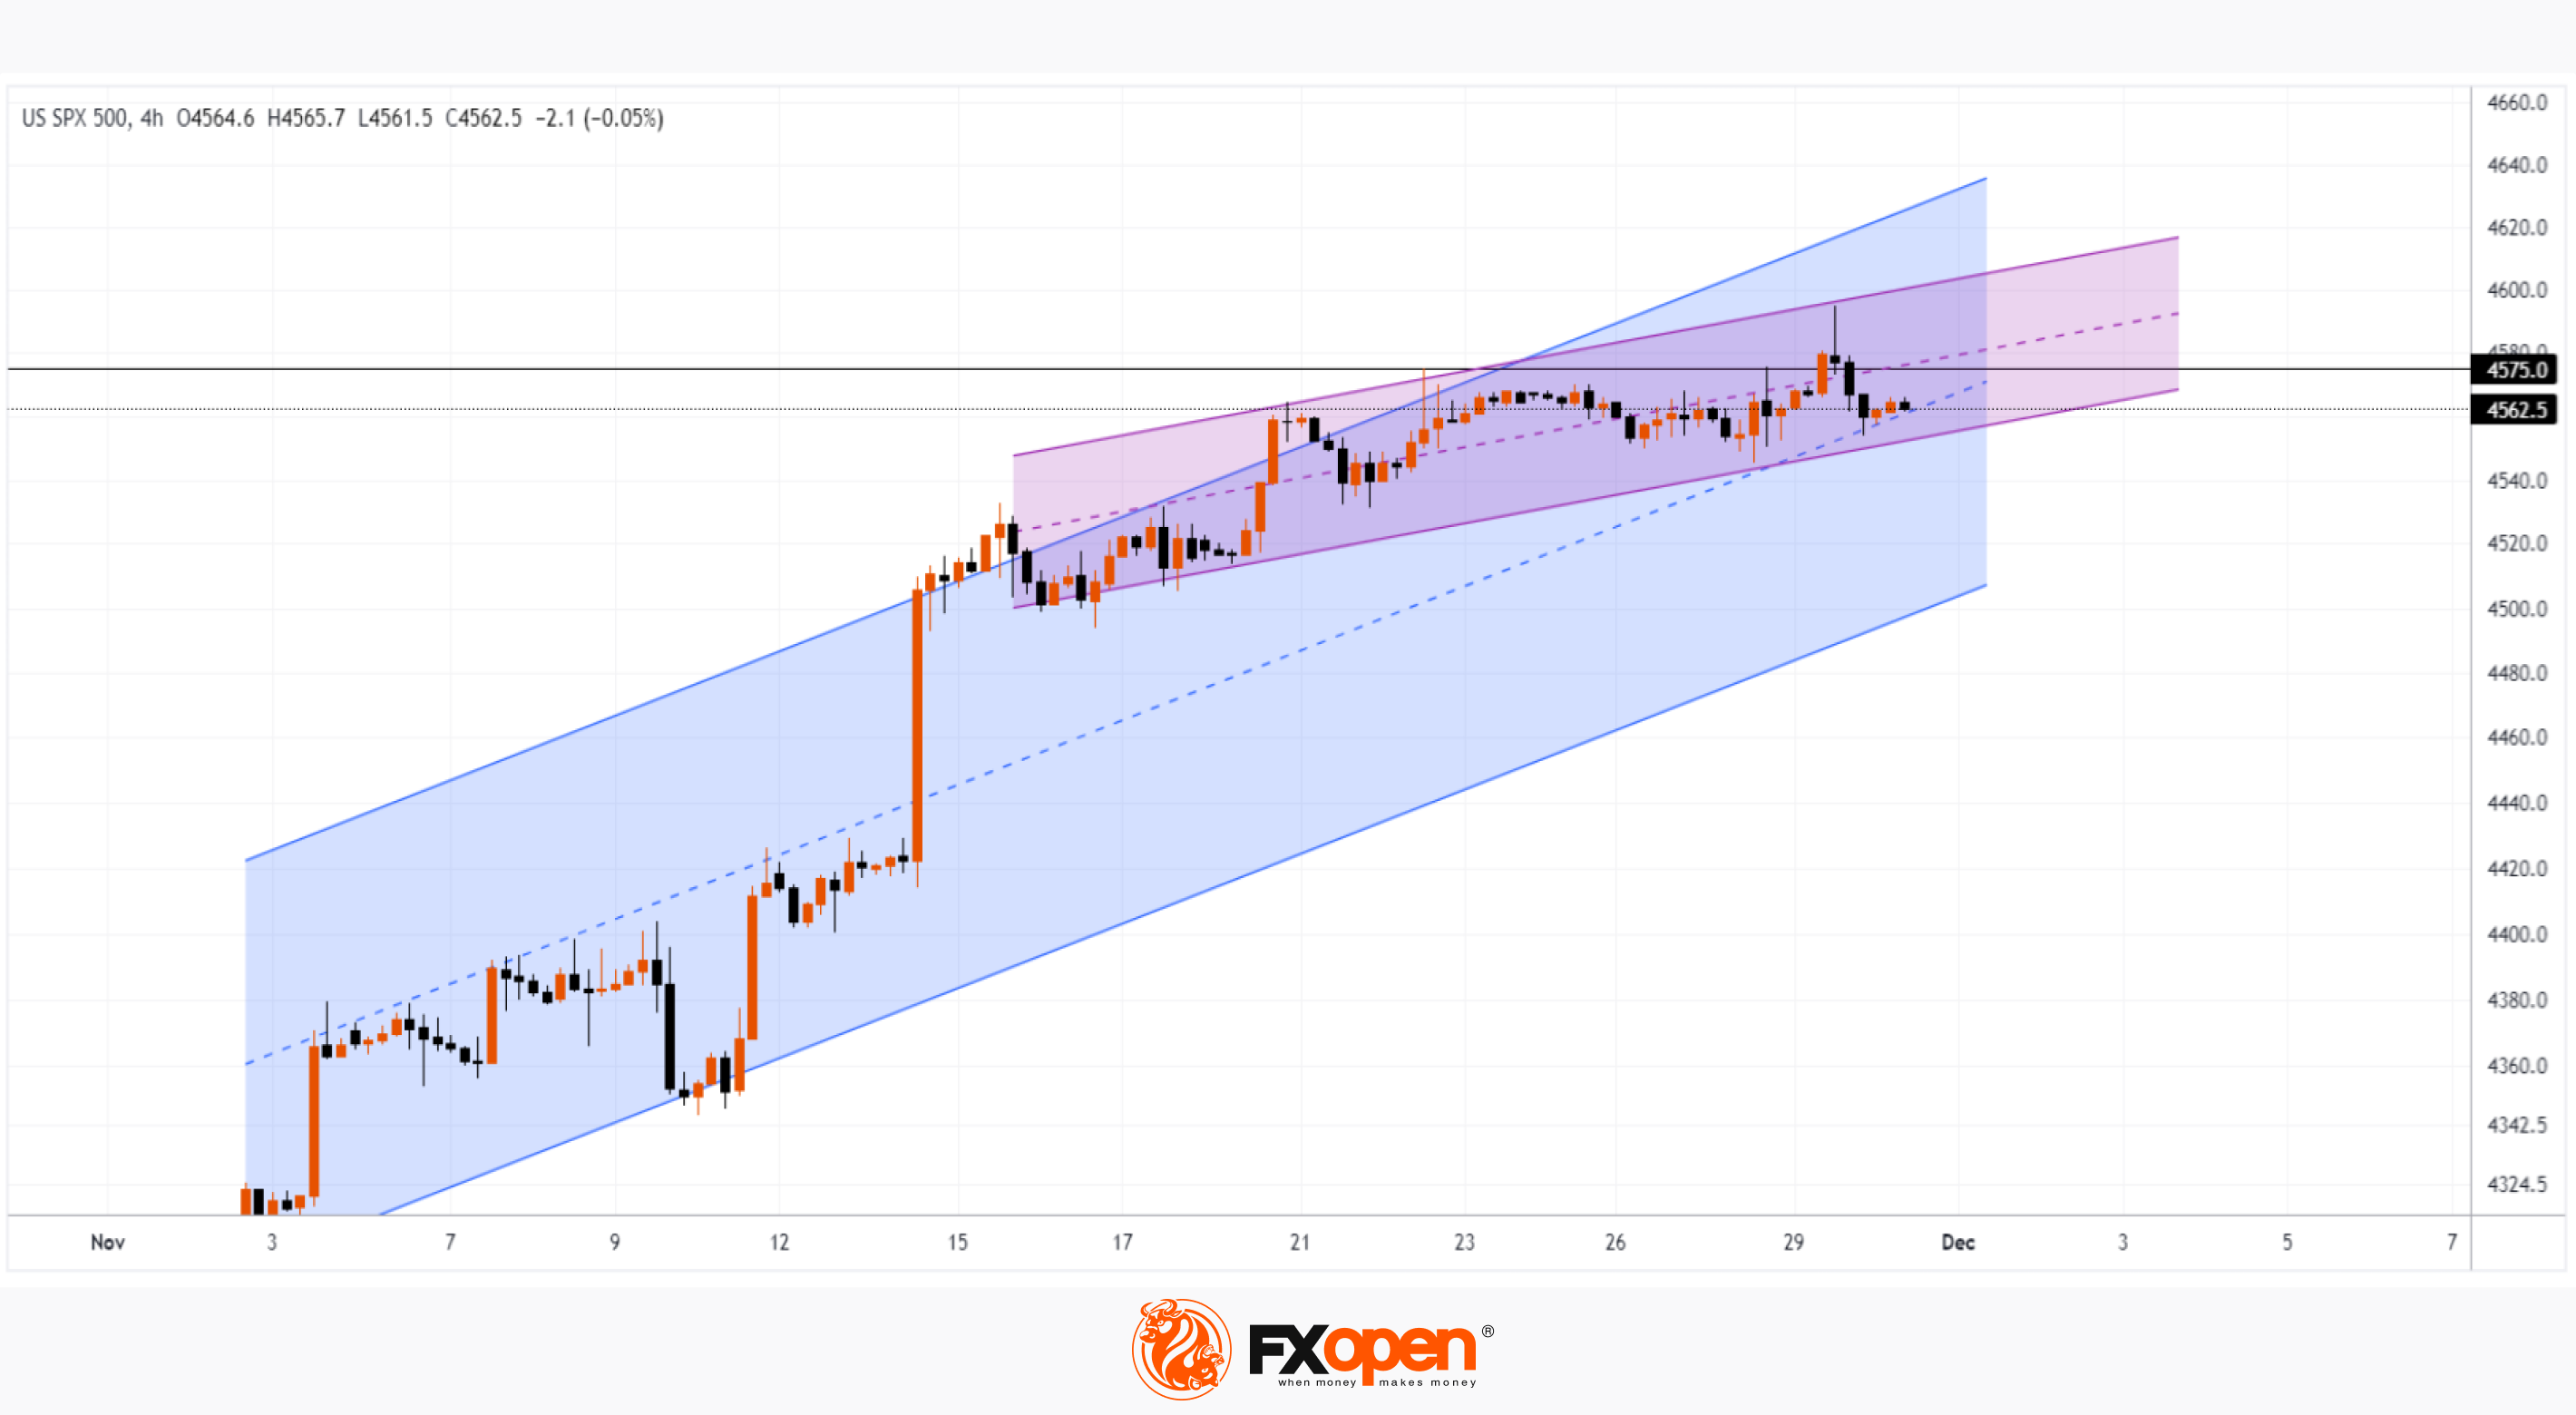
Against the background of this news, the S&P 500 index yesterday rose closer to the highs of the year. However, the chart shows that the November rally may not continue into December. Note:
→ Most of November's progress was achieved in the first half of the month. In the second half, growth slowed down, as evidenced by the change in the angle of inclination of the purple channel relative to the blue channel.
→ Level 4,575 effectively provides resistance.
→ After the formation of yesterday’s top (against the backdrop of news), sellers were able to sharply lower the price - thus forming a false breakout of the 4575 level.
Of course, the upward trend has not yet been formally broken - the market may find support from the median line of the ascending channel and then try to set the year's high for the S&P 500. But it seems that the price is already taking into account all possible positive influence factors. And if any negative factors arrive, this will lead to a correction in November growth.
By the way, JP Morgan analysts released their forecast that the price of the S&P 500 will fall to 4200 next year amid a “challenging macroeconomic backdrop.”
Trade global index CFDs with zero commission and tight spreads (additional fees may apply). Open your FXOpen account now or learn more about trading index CFDs with FXOpen.
This article represents the opinion of the Companies operating under the FXOpen brand only. It is not to be construed as an offer, solicitation, or recommendation with respect to products and services provided by the Companies operating under the FXOpen brand, nor is it to be considered financial advice.
Stay ahead of the market!
Subscribe now to our mailing list and receive the latest market news and insights delivered directly to your inbox.


Latest articles

Weekly Market Insights with Gary Thomson: The Week of Central Banks and Earnings
In this video, we’ll explore the key economic events and market trends, shaping the financial landscape. Get ready for insights into financial markets to help you navigate the week ahead. Let’s dive in!
In this episode of Market

Intel at a Crossroads: Earnings Beat Meets Technical Resistance
Intel has just delivered its strongest quarter in over fifteen years, and the market reaction says it all. Q2 2026 revenue surged 25% year-over-year to $16.1 billion, crushing the consensus estimate of $14.42 billion, while adjusted EPS of

Tesla: Complex Range Structure Breaks Down Following Quarterly Earnings
Tesla released its Q2 2026 results after the market closed on 22 July. Revenue increased 26% year-on-year to $28.24 billion, while vehicle deliveries reached a record 480,126 units. However, operating margin fell sharply to 1.4%, down from