


Market Analysis: The Price of Gold Drops Below $1,900
FXOpen

The decline in the price of the asset considered a safe haven was facilitated by rising bond yields, which are becoming more attractive for investment in a high-interest environment. According to top Federal Reserve officials, new increases are possible to achieve inflation targets.
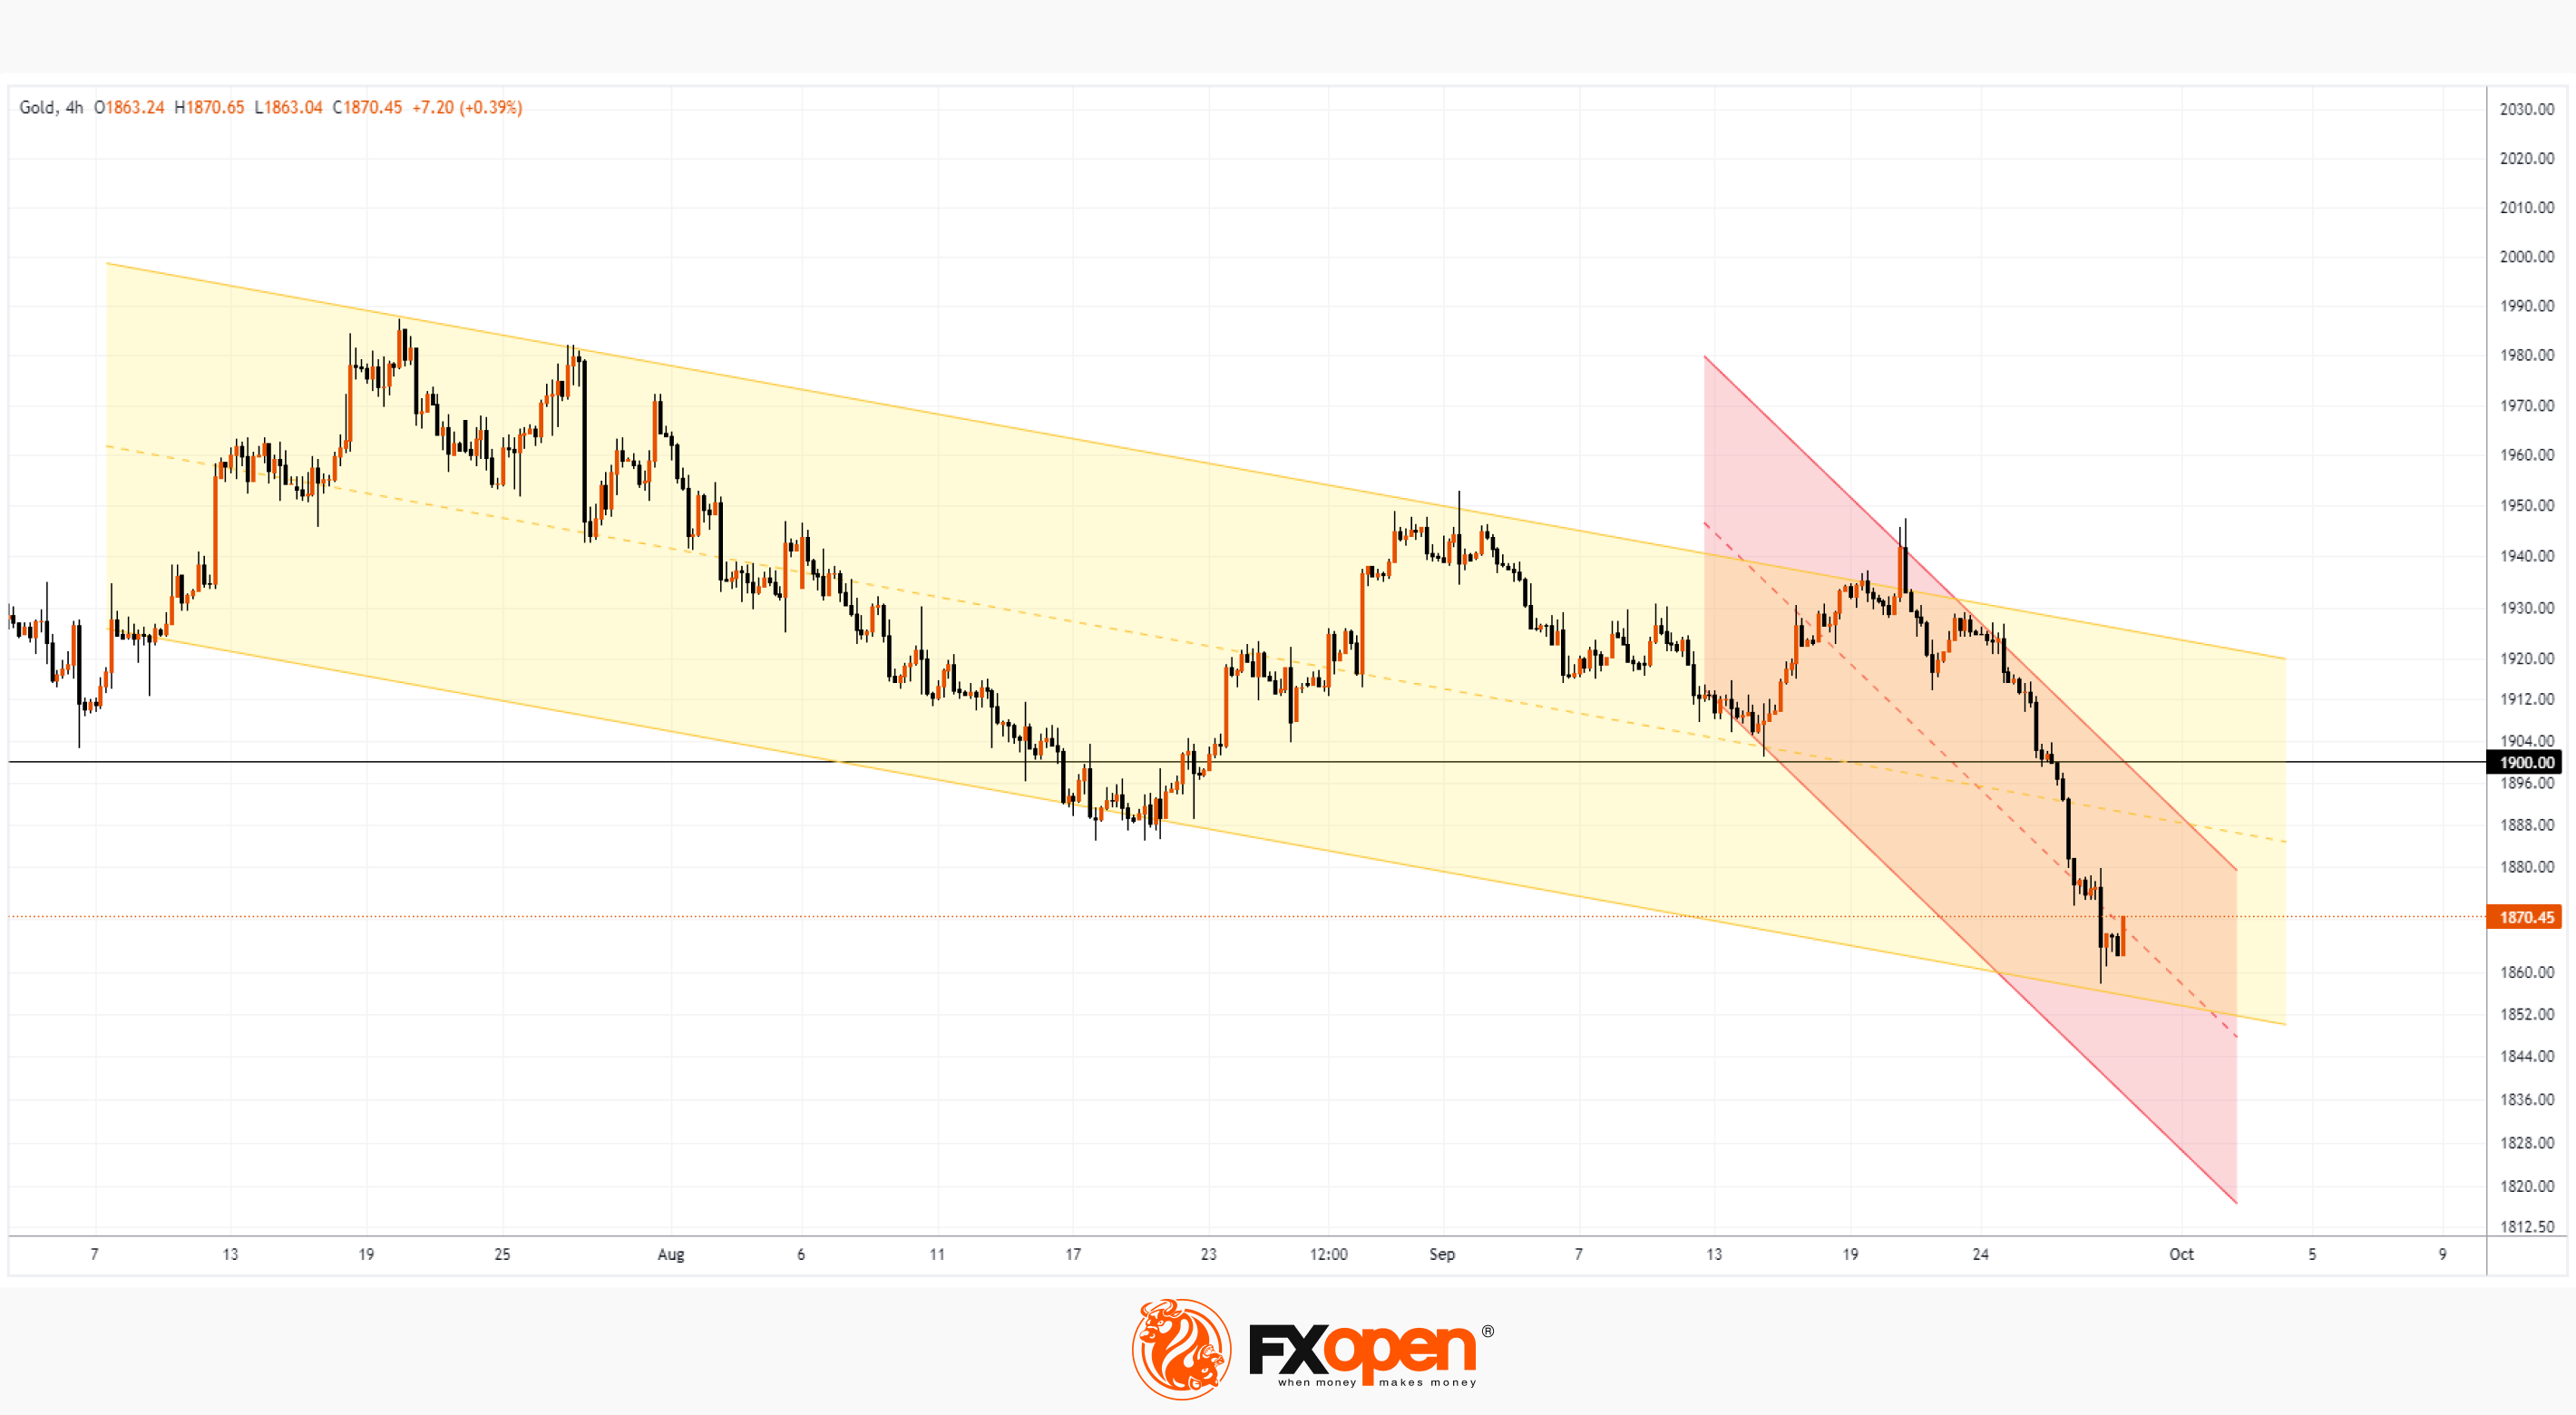
At yesterday's low, the price fell below 1,860 per ounce for the first time since March 2023. Will the fall continue? The XAU/USD chart on the 4-hour time frame provides valuable information for thought.
Bearish arguments:
→ Falling tops above the 1,900 level, which formed during August-September, indicate a steady decline in demand.
→ The price is within the local downward channel (shown in red), its upper limit can serve as resistance for recovery and/or a factor for the formation of a new downward impulse.
→ After breaking through the 1,900 level, the price accelerated its decline, which indicates the bears’ confidence.
Bullish arguments:
→ The price has reached the lower border of the channel shown in yellow. This line may provide support, which is already noticeable by the price rebound from yesterday’s low and the positive dynamics in the Asian session today.
→ At the low of the day yesterday, large volumes of trading in gold futures took place on the CME, which may indicate the interest of large players in buying out short positions or even establishing long positions for long-term portfolios.
Start trading commodity CFDs with tight spreads (additional fees may apply). Open your trading account now or learn more about trading commodity CFDs with FXOpen.
This article represents the opinion of the Companies operating under the FXOpen brand only. It is not to be construed as an offer, solicitation, or recommendation with respect to products and services provided by the Companies operating under the FXOpen brand, nor is it to be considered financial advice.
Stay ahead of the market!
Subscribe now to our mailing list and receive the latest market news and insights delivered directly to your inbox.


Latest articles

AI Valuations Are Back in the Spotlight
Artificial intelligence remains the dominant investment theme of 2026, but investors are increasingly questioning whether AI stock valuations are keeping pace with reality.
💰 Big Tech continues to invest at an unprecedented scale, with hyperscaler AI spending projected to exceed $800

AUD/CAD: Months of Indecision — Is a Breakout Finally Coming?
The Australian dollar has clawed back most of its end-of-June losses, when it touched three-month lows against the greenback amid escalating Middle East tensions. Since then, sentiment has improved: the RBA's Assistant Governor Sarah Hunter signalled the board stands ready

USD/JPY: Battling at the Top of the Triangle
On 3 July, Japan's Finance Minister, Satsuki Katayama, stated that the Ministry of Finance remains in close contact with US authorities regarding developments in USD/JPY as the yen traded near its weakest level in almost 40 years. Similar verbal