


Market Analysis: The Price of Gold Rose by 3% in 10 Days
FXOpen

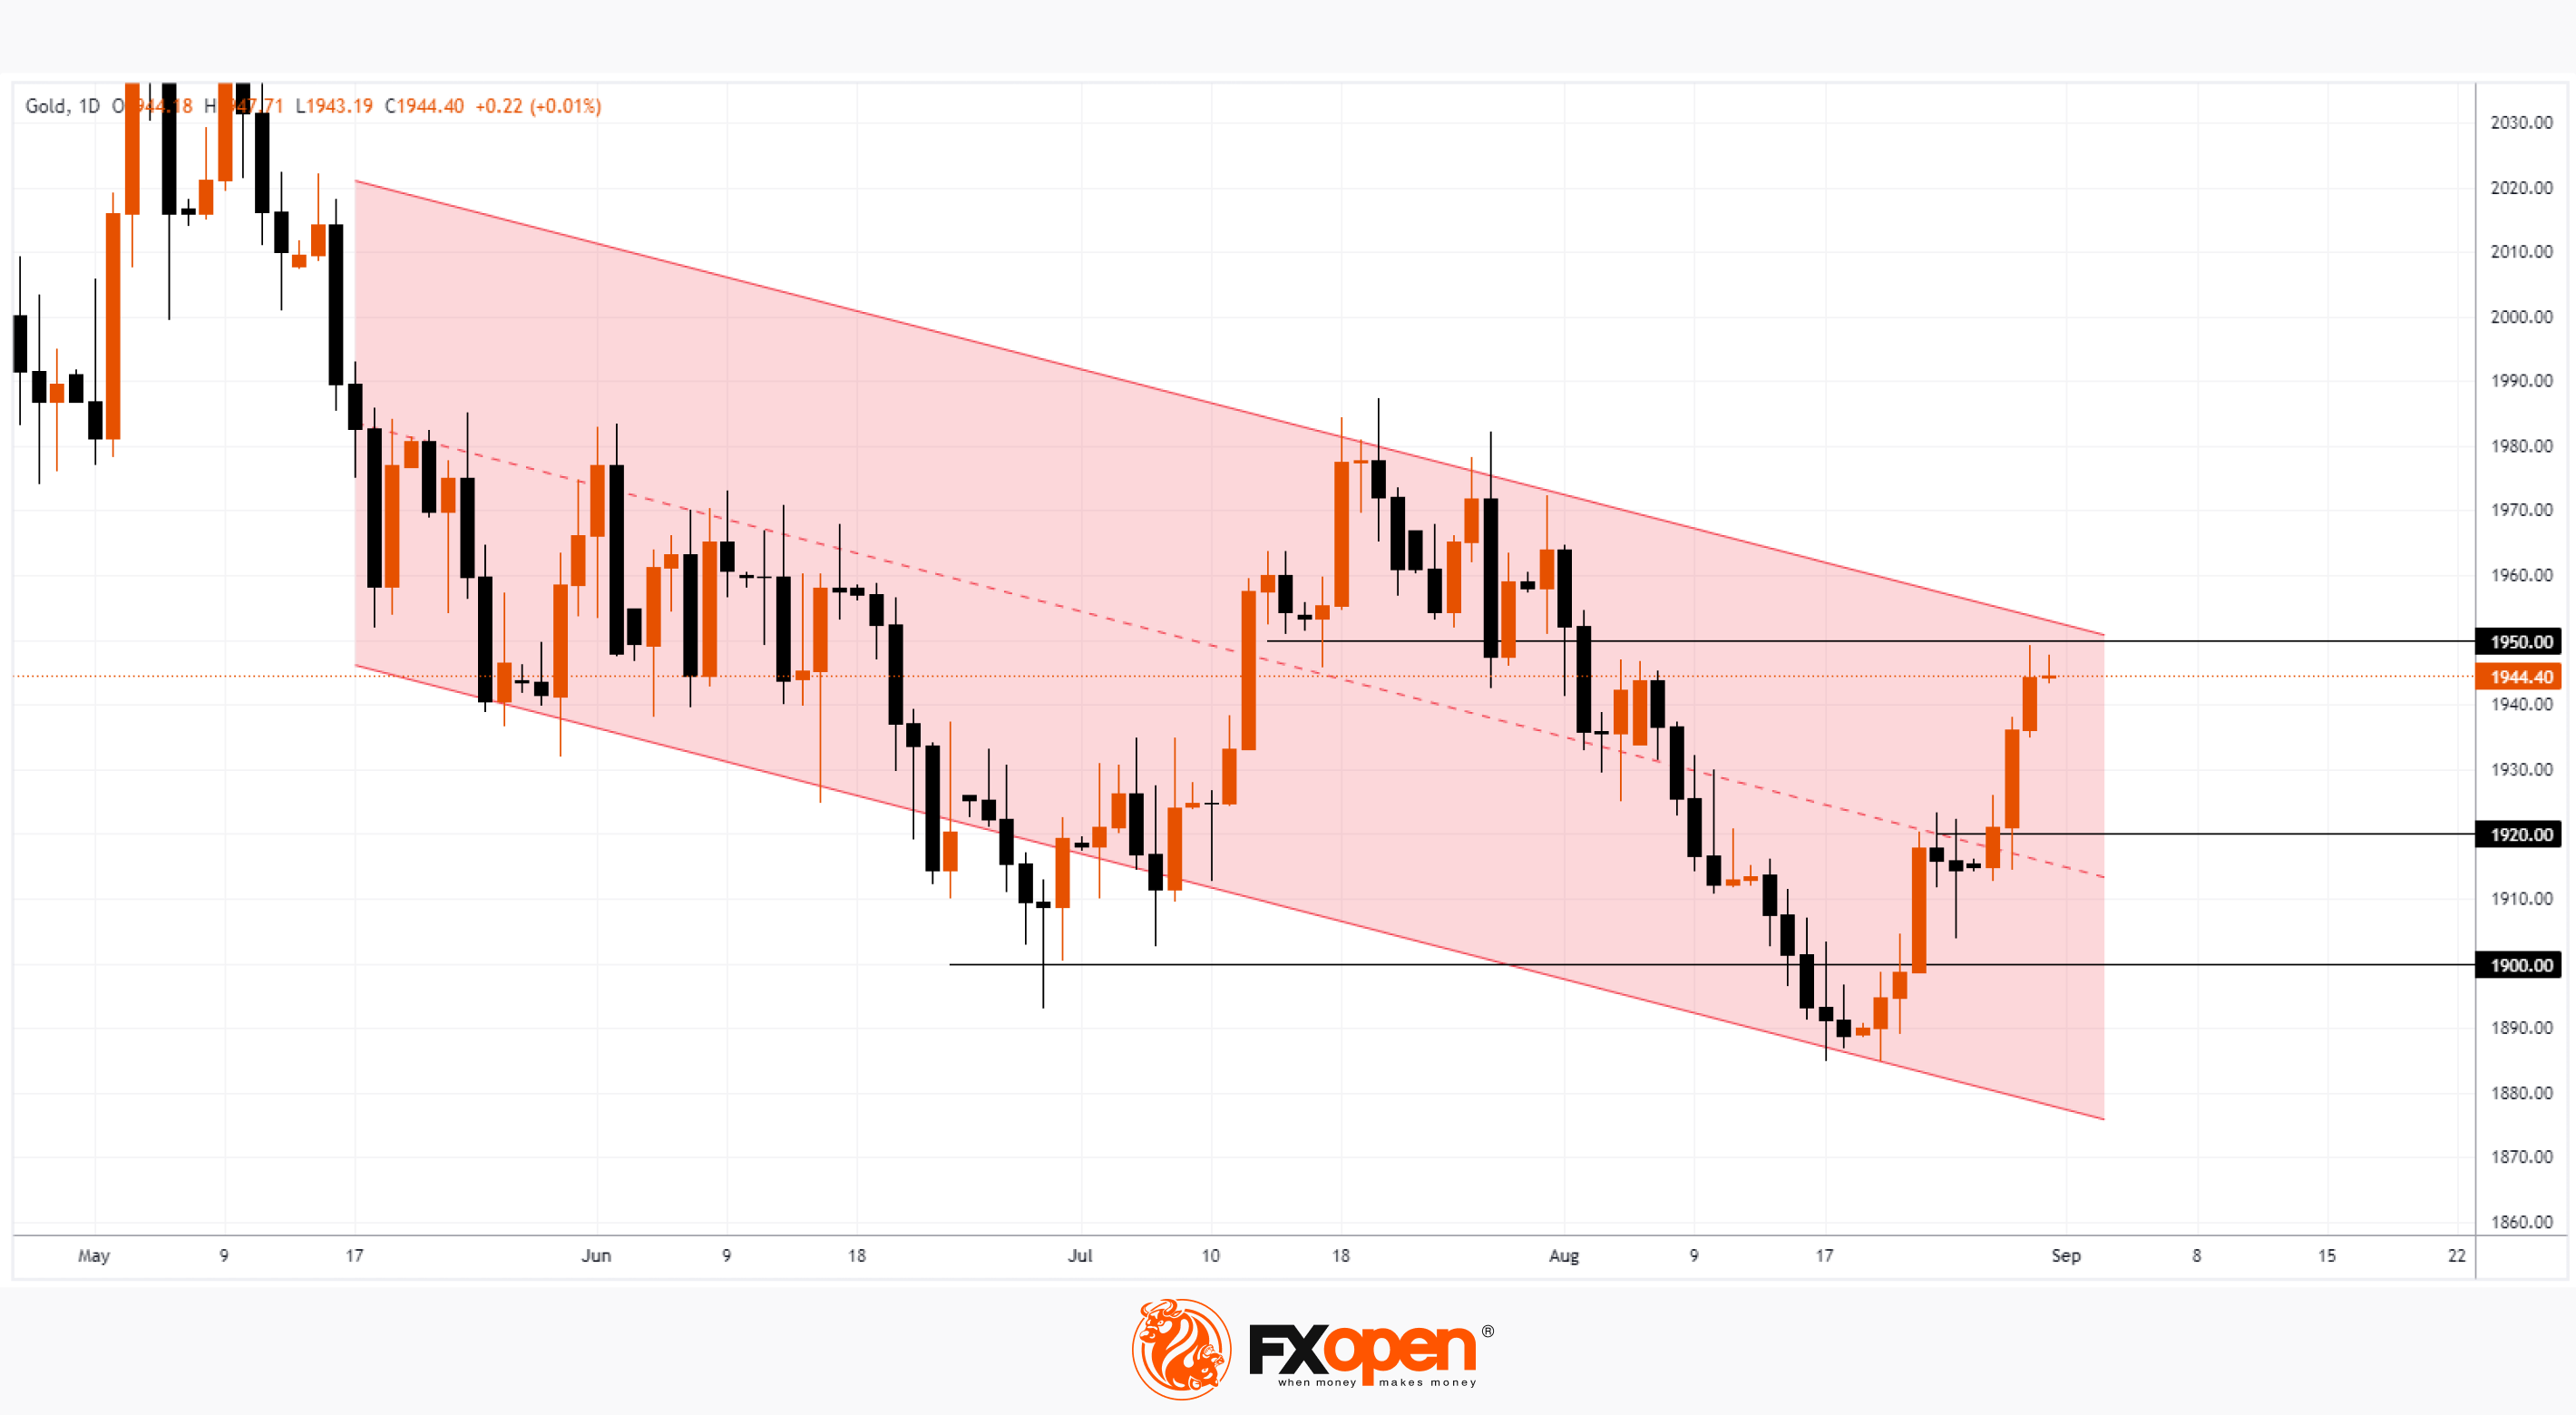
Back on August 21, gold was trading below USD 1,890 an ounce, but to date, its price has risen by about 3%. This was helped by published data on the number of vacancies in the US, which fell to the lowest level in almost 2.5 years in July. This and other signals of a slowdown in the US economy may influence the Fed's decision to continue raising interest rates further, which weakens the US dollar and supports the price of gold.
Bullish arguments:
→ the psychological barrier of USD 1,900 serves as an important support. The price of gold was there for only a few days, after which a steady increase followed.
→ The USD 1,920 resistance level was taken under control by the bulls after the breakdown on August 28-29. Now we can expect that there will be support here.
→ If a moderate decline on low volumes follows in the coming days, this will be a sign of a normal correction in a bull market
Bearish arguments:
→ Expect resistance from USD 1,950. It is possible that if an attack follows it, it will turn into a false breakdown.
→ Gold is within a descending channel (shown in red) and its upside price may be resisting gold's uptrend.
Be prepared for a surge in volatility today at 15:30 GMT+3, at which time Personal Consumption Expenditure (PCE) and monthly employment figures are released, important indicators of the economy in terms of impact on US interest rates.
Start trading commodity CFDs with tight spreads (additional fees may apply). Open your trading account now or learn more about trading commodity CFDs with FXOpen.
This article represents the opinion of the Companies operating under the FXOpen brand only. It is not to be construed as an offer, solicitation, or recommendation with respect to products and services provided by the Companies operating under the FXOpen brand, nor is it to be considered financial advice.
Stay ahead of the market!
Subscribe now to our mailing list and receive the latest market news and insights delivered directly to your inbox.


Latest articles

AI Valuations Are Back in the Spotlight
Artificial intelligence remains the dominant investment theme of 2026, but investors are increasingly questioning whether AI stock valuations are keeping pace with reality.
💰 Big Tech continues to invest at an unprecedented scale, with hyperscaler AI spending projected to exceed $800

AUD/CAD: Months of Indecision — Is a Breakout Finally Coming?
The Australian dollar has clawed back most of its end-of-June losses, when it touched three-month lows against the greenback amid escalating Middle East tensions. Since then, sentiment has improved: the RBA's Assistant Governor Sarah Hunter signalled the board stands ready

USD/JPY: Battling at the Top of the Triangle
On 3 July, Japan's Finance Minister, Satsuki Katayama, stated that the Ministry of Finance remains in close contact with US authorities regarding developments in USD/JPY as the yen traded near its weakest level in almost 40 years. Similar verbal