


The Price of Gold (XAU/USD) Has Descended to a Significant Support Level
FXOpen

The beginning of 2024 has not been the most positive for gold investors, despite a promising December 2023 when XAU/USD prices reached a historical high of $2135.39 per ounce, primarily due to a weak US dollar and expectations that the Federal Reserve (Fed) would begin lowering interest rates.
However, from the first trading day of January, the price of gold (XAU/USD) has fallen from around $2061 to current levels of around $2015 per ounce (a decrease of 2.3%). This is somewhat surprising considering that gold has a reputation as a defensive asset, and geopolitical tensions persist. Perhaps the price is undergoing a correction after reaching a historical high, pulling back from overbought conditions (evident from the RSI indicator).
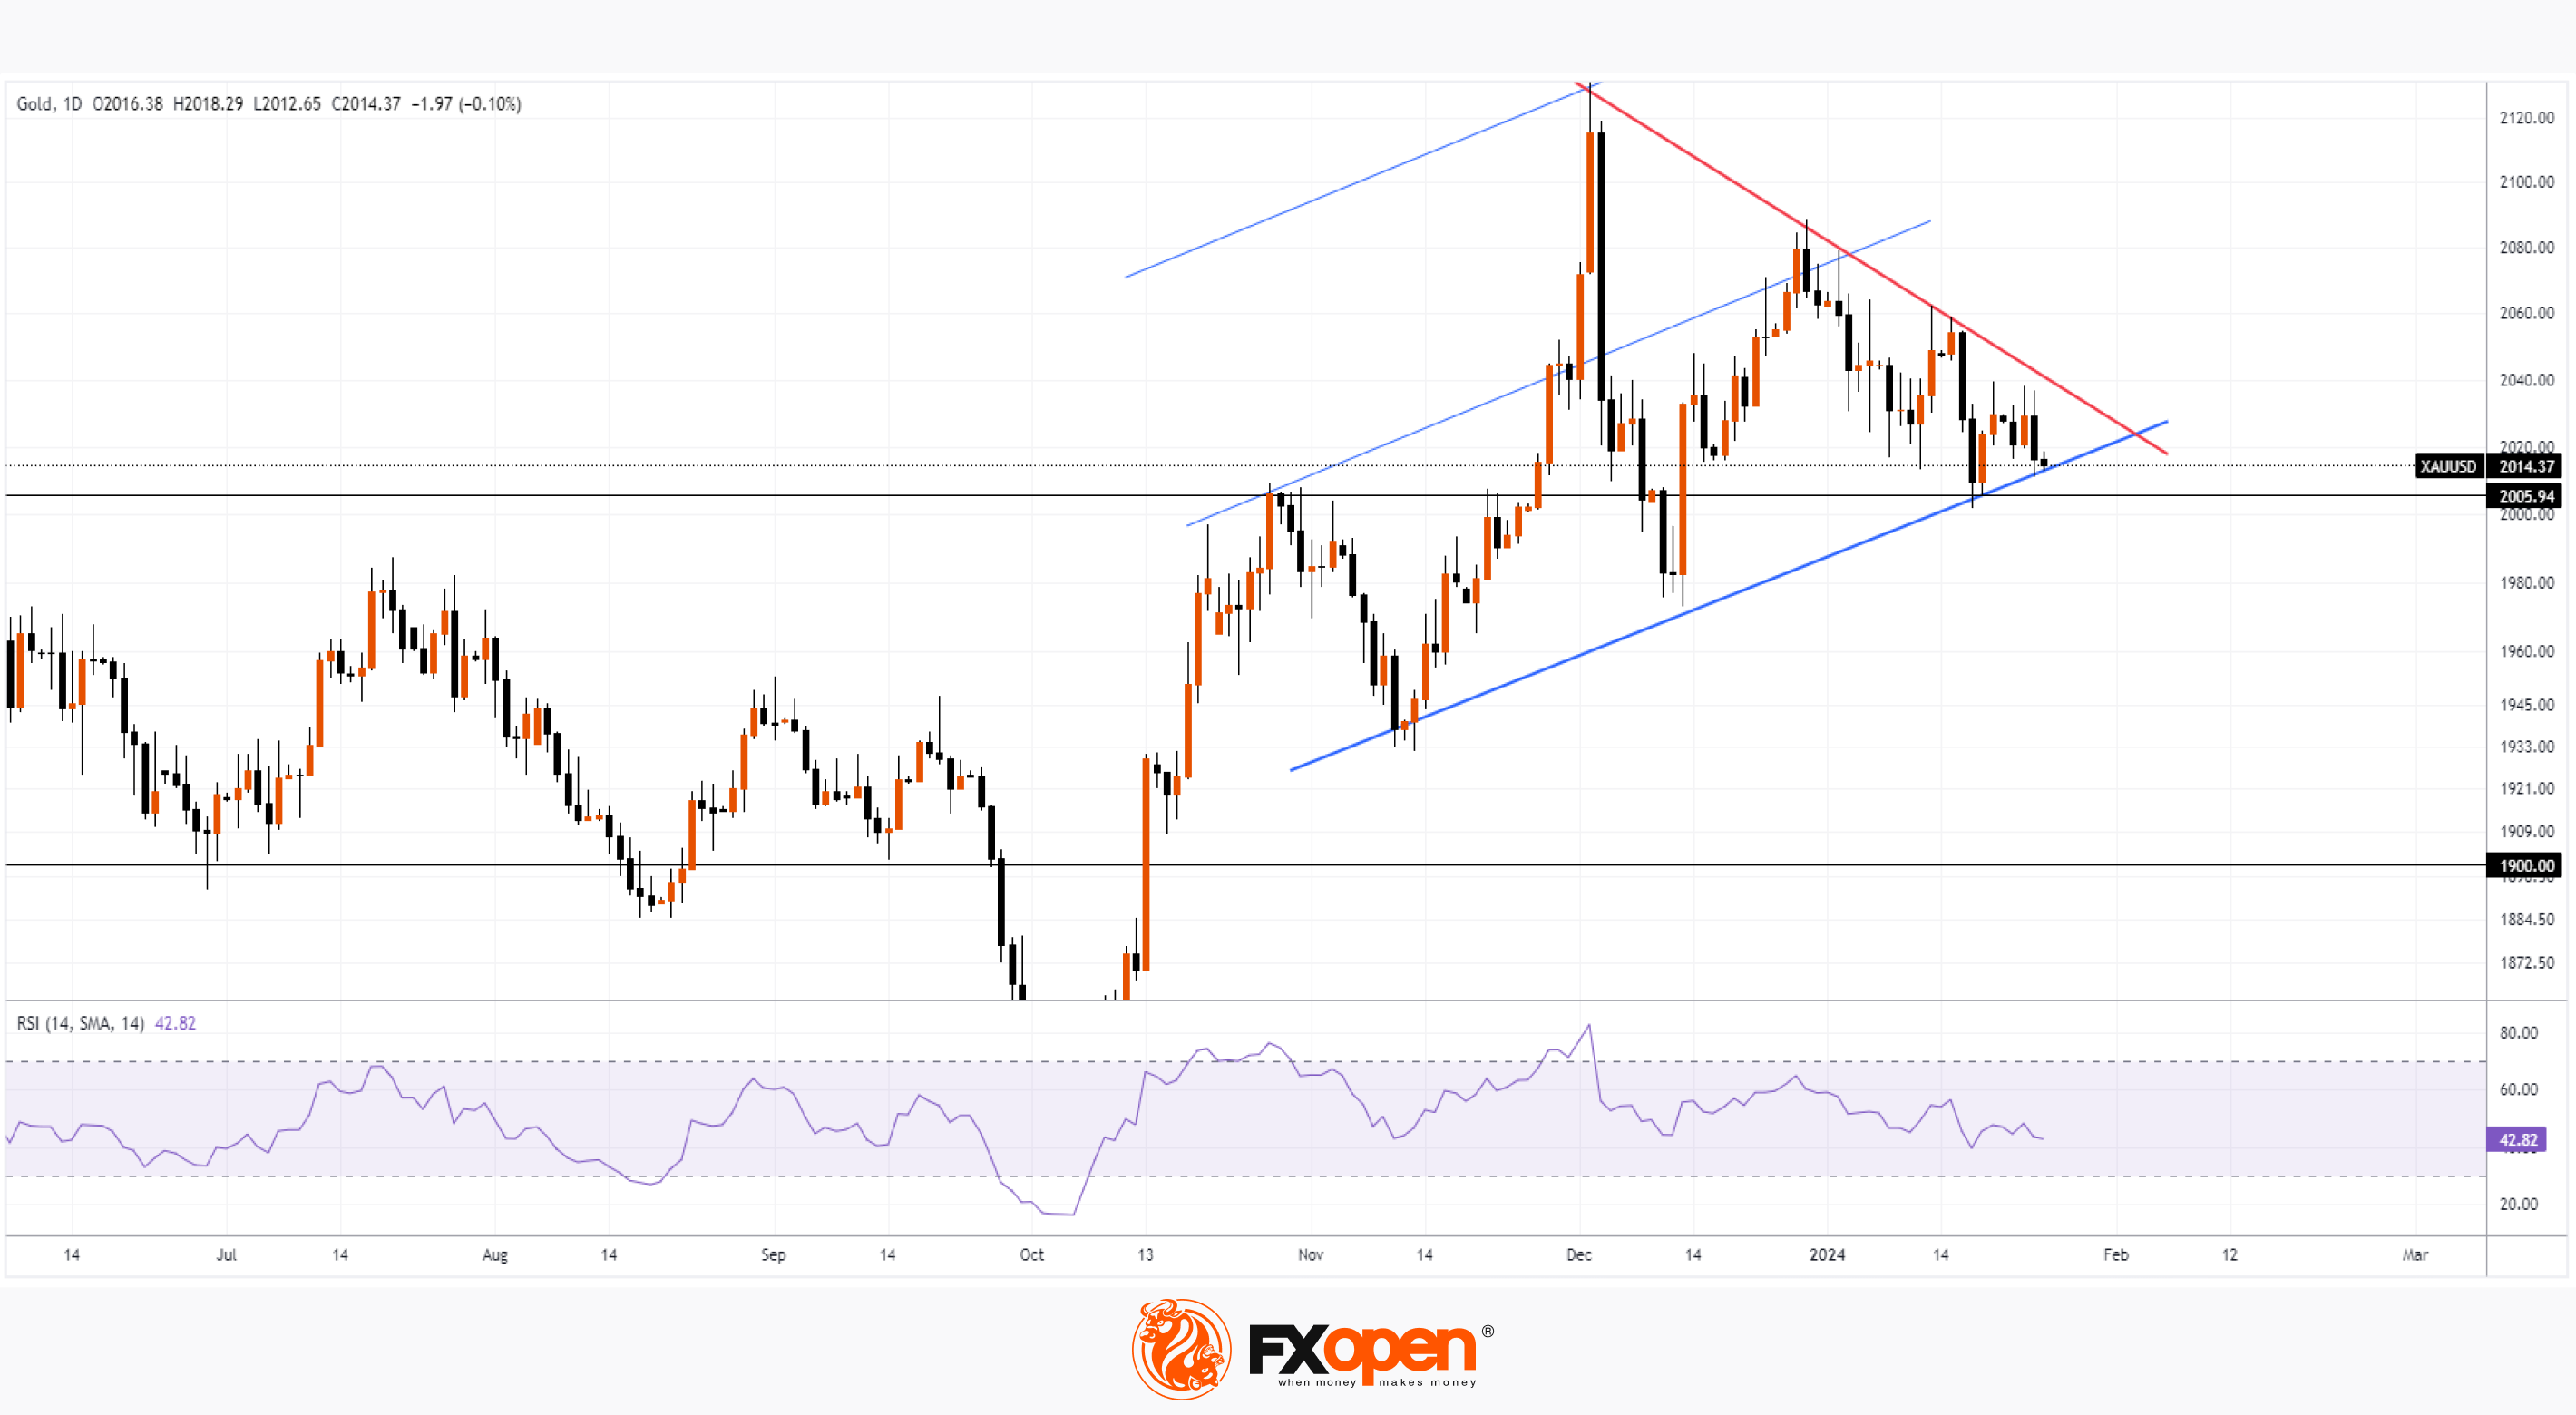
The XAU/USD gold chart indicates that:
→ the price has descended to the psychological level of $2000 per ounce, which already showed support on January 17th;
→ the price is also near an important trendline (indicated by the thickened blue line), from which support can be expected;
→ the price is forming a consolidation pattern between the thickened red and blue lines.
What's next?
JPMorgan analysts believe that in 2024, the price of gold (XAU/USD) will reach $2300 as the US GDP growth slows down and the Fed reduces interest rates. However, they suggest that this is likely to happen in the second half of the year, and in the first half, a decline is more probable, increasing the likelihood of a bearish breakout from the current consolidation pattern.
Start trading commodity CFDs with tight spreads (additional fees may apply). Open your trading account now or learn more about trading commodity CFDs with FXOpen.
This article represents the opinion of the Companies operating under the FXOpen brand only. It is not to be construed as an offer, solicitation, or recommendation with respect to products and services provided by the Companies operating under the FXOpen brand, nor is it to be considered financial advice.
Stay ahead of the market!
Subscribe now to our mailing list and receive the latest market news and insights delivered directly to your inbox.


Latest articles

Apple: Earnings Day Above the Activity Zone
On 30 April, after the market close, Apple Inc. will release its financial results for the second quarter of fiscal 2026. The consensus forecast, based on estimates from 31 analysts, points to revenue of around $109.7 billion, with expected

USD/JPY and USD/CHF Near Key Levels: The Dollar Supported by the Fed
The US dollar continues to trend upwards following the Federal Reserve meeting, drawing support from the regulator’s moderately hawkish stance and comments by Jerome Powell. Markets interpret the Fed’s rhetoric as a signal that restrictive policy is likely

EUR/USD and GBP/USD consolidate ahead of the Fed decision
European currencies are showing subdued dynamics, entering a consolidation phase following their previous advance. Earlier, EUR/USD and GBP/USD broke out of their ranges and strengthened; however, the subsequent correction has led both pairs to retest the previously breached