


FXOpen
The S&P 500 remains in its longest rally since 2018 without a decline of at least 2%, according to data compiled by Bloomberg; analysts note that there hasn't been a correction of this size in 266 trading sessions.
The positive sentiment of market participants is due to:
→ the prospect of lowering interest rates by the Federal Reserve;
→ enthusiasm for AI and its positive impact on economic development.
However, although the fundamental background is strong, current estimates of the US500 index may be overestimated — in fact, this is the essence of the correction.
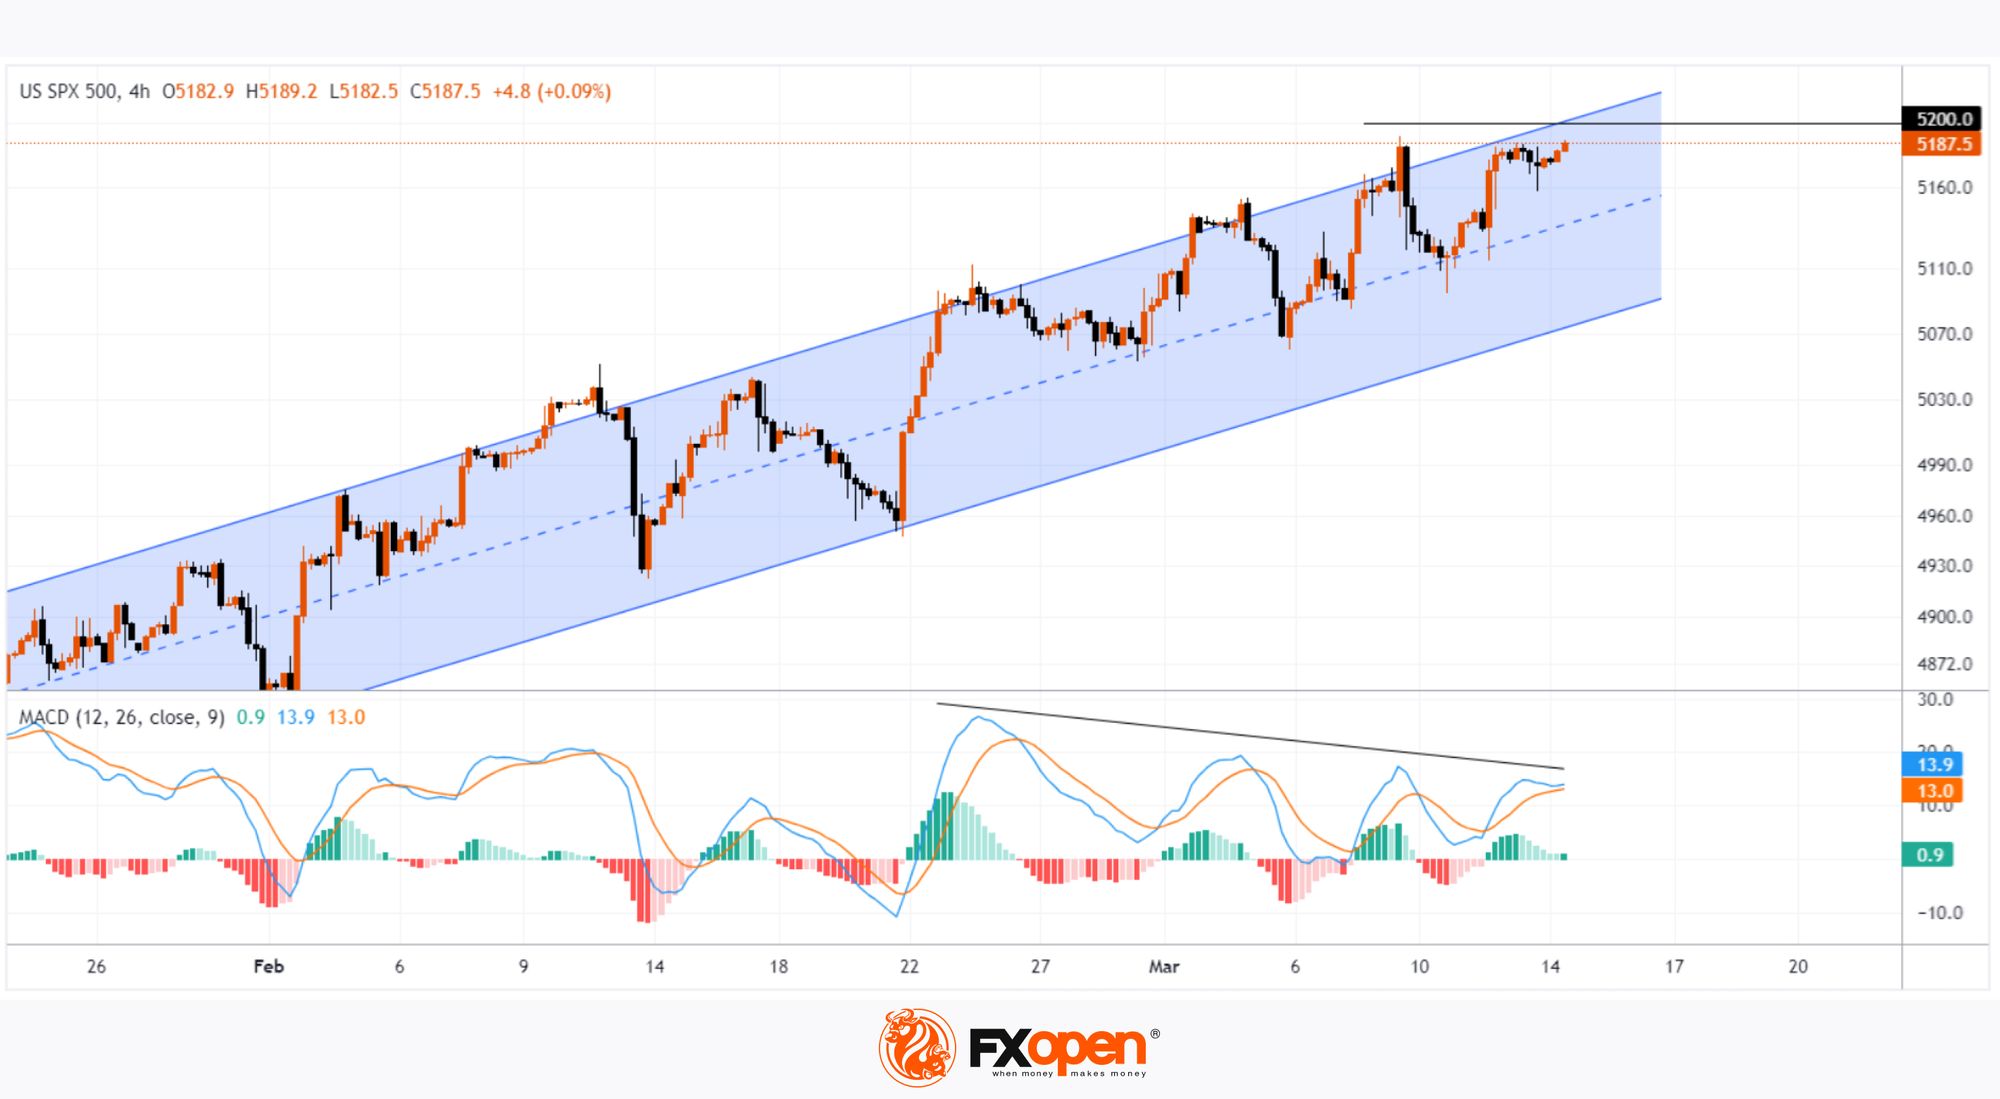
The US500 chart shows that:
→ the price is in an upward trend (shown by the blue channel);
→ the price moves in the upper half of the channel, and the median line acts as support — a sign of strong demand;
→ on the morning of March 14, the market is showing signs of positivity, indicating that an attempt to overcome the resistance of 5,200 points and take a new record high may be made in the near future.
However, the MACD is holding back optimism — the popular oscillator is forming a bearish divergence pattern, which hints at the gradual fading of bullish impulses.
Given the above, bulls should be cautious as the market looks vulnerable to a correction, such as to the lower border of the channel. But this requires a trigger. One of these could be news about inflation in the US; the values of the Producer Price Index (as well as data on retail sales in the US) will be published today at 15:30 GMT+3. Be prepared for spikes in volatility.
Trade global index CFDs with zero commission and tight spreads. Open your FXOpen account now or learn more about trading index CFDs with FXOpen.
This article represents the opinion of the Companies operating under the FXOpen brand only. It is not to be construed as an offer, solicitation, or recommendation with respect to products and services provided by the Companies operating under the FXOpen brand, nor is it to be considered financial advice.
Latest articles

Google Share Price Rose Post-market to a New All-time Record
Yesterday, after the close of the main trading session, a report on activities for the 1st quarter of Alphabet Inc. (Google's parent company) was published. The report was strong, exceeding investors' expectations.
→ Quarterly EPS = USD 1.89 (expected = USD 1.
S&P 500 Rebounds after Negative GDP News
Data released yesterday showed US GDP growth slowed to 1.6% in the first quarter of the year. According to ForexFactory: forecast = 2.2%, past value = 2.4%.
Reaction to the news sent the S&P 500 mini stock
GBP/USD And USD/CAD Daily Chart Outlook
GBP/USD is attempting a recovery wave from 1.2300. USD/CAD is consolidating and might aim for a move above the 1.3760 resistance zone.
Important Takeaways for GBP/USD and USD/CAD Analysis Today
· The British Pound started