


WTI Oil Analysis: Price Falls 10% in Less Than a Week
FXOpen

In our article “Oil Analysis: Finally, A Bearish Reversal?” on September 21, we drew attention to emerging signs that the initiative was shifting to the bears. This was noticeable in the changes in the dynamics of impulses and corrections, as well as in the analysis of the interaction between trading volumes and prices.
Since then, the bulls were able to update the high of the year on September 28, but the price did not stay there for long, falling sharply in the following days. Three bearish candles formed on the chart, which confirmed the problems of the bulls, and the double top pattern (A-B) also became relevant.
Another principle of technical analysis that emphasized the dominance of supply over demand is that each upward move was approximately 2 times weaker than the downward move. This can be seen in the consistent structure characteristic of a bearish trend:
→ the C→D move is approximately 50% of the B→C bearish momentum;
→ the rebound from the median line of the ascending channel E→F is approximately 50% of the bearish impulse D→E;
→ the bounce from the (now former) support line 87.50 G→H is approximately 50% of the bearish momentum F→G.
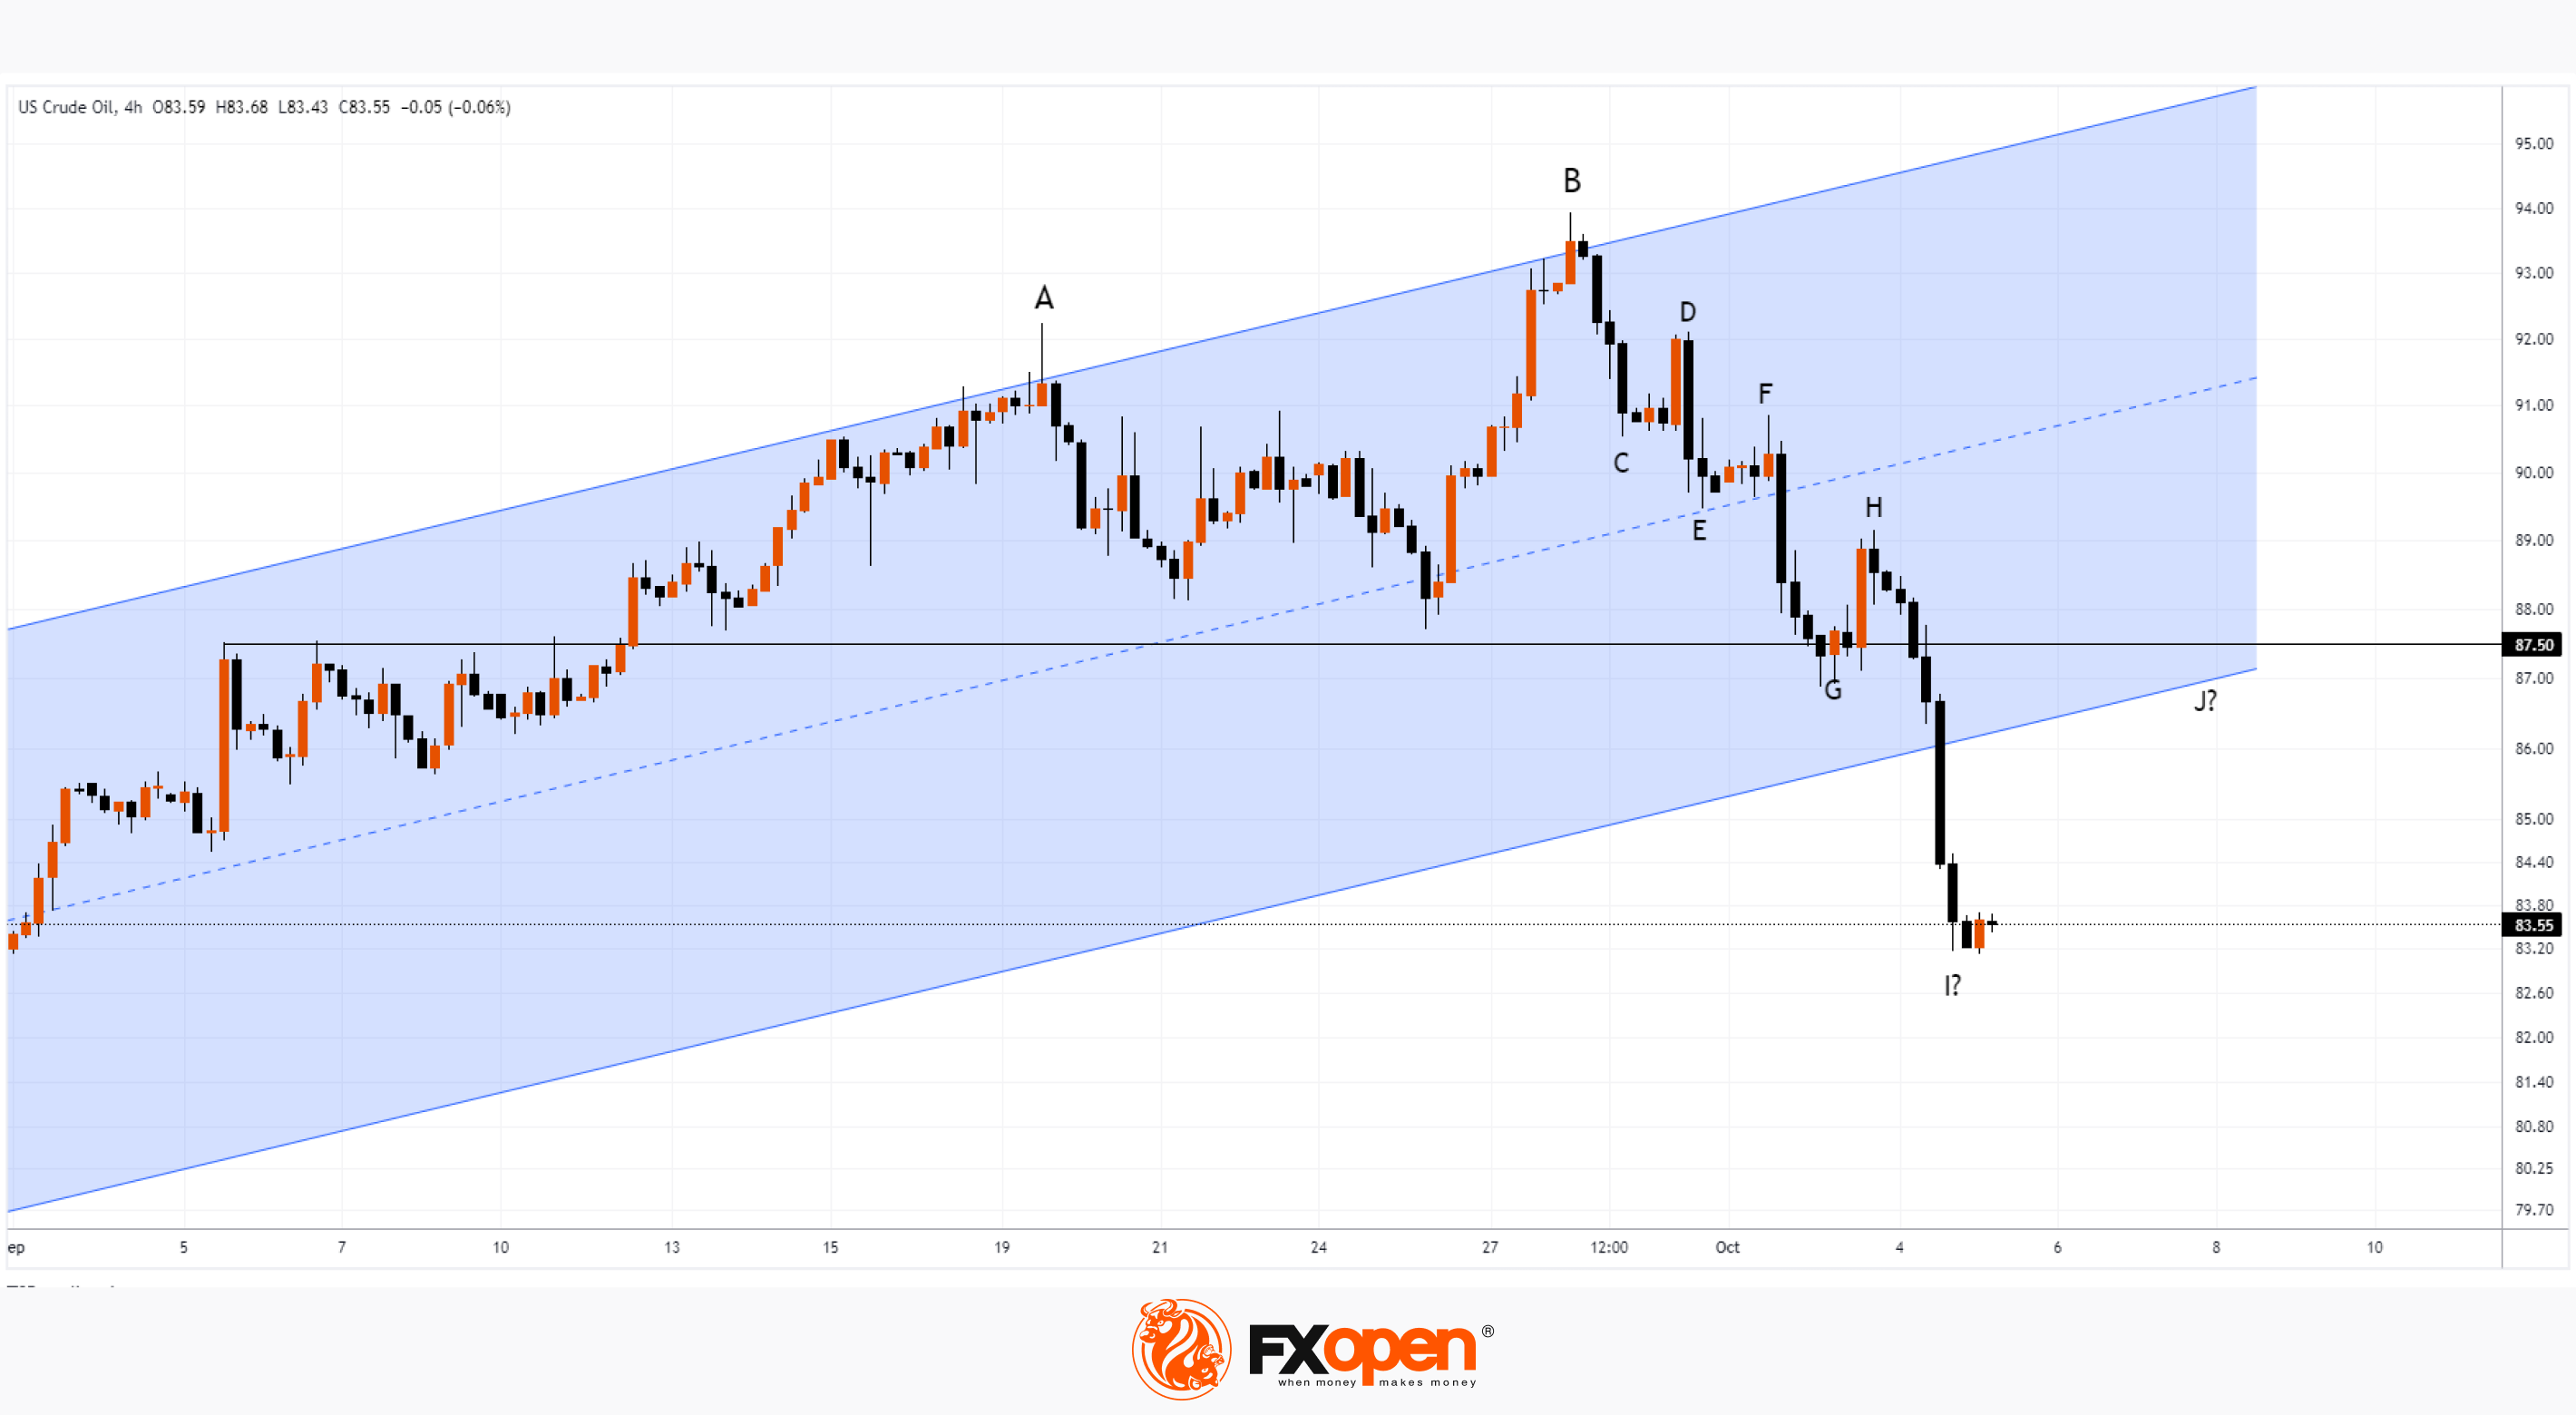
Yesterday, the US Energy Information Administration (EIA) reported that supplies of finished motor gasoline, reflecting demand, fell to about 8 million barrels per day, the lowest since the beginning of this year. The news contributed to the formation of a new bearish impulse, which broke through the ascending channel (shown in blue).
It is possible that another I→J rollback will follow. If so, then the formation of top J may be facilitated by resistance from the level of 87.50, the lower border of the ascending channel and the 50% Fibo level.
Start trading commodity CFDs with tight spreads (additional fees may apply). Open your trading account now or learn more about trading commodity CFDs with FXOpen.
This article represents the opinion of the Companies operating under the FXOpen brand only. It is not to be construed as an offer, solicitation, or recommendation with respect to products and services provided by the Companies operating under the FXOpen brand, nor is it to be considered financial advice.
Stay ahead of the market!
Subscribe now to our mailing list and receive the latest market news and insights delivered directly to your inbox.


Latest articles

Dow Jones (DJIA): Consolidation Beyond the Trend
Federal Reserve Chair Kevin Warsh testified before Congress on 14–15 July, reaffirming the Fed's commitment to bringing inflation back to target while providing no clear guidance on the future path of interest rates. Meanwhile, June inflation data came in

European Currencies Strengthen Ahead of Key Macroeconomic Releases
EUR/USD and GBP/USD continue to recover moderately following the recent weakening of the US dollar. European currencies have been supported by expectations that US inflationary pressures will continue to ease after softer-than-expected CPI and PPI data, reinforcing market

Brent Crude Oil: From Ceasefire to Crossfire — What's Next?
Just weeks ago, traders were pricing in peace. Now they're pricing in war again—and that reversal says everything about how fragile the current Middle East calm really is.
Brent crude has surged to $86 a barrel, its highest level