


Peercoin, Namecoin Refuse to Follow BTC Higher
FXOpen
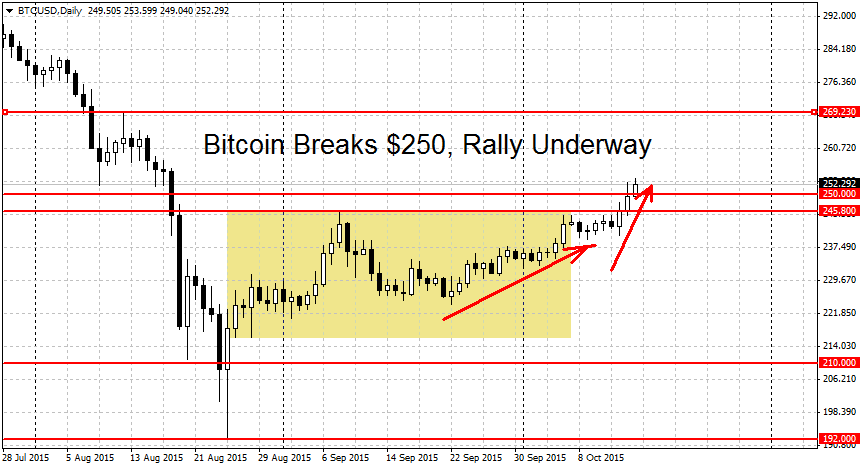
Bitcoin finally broke above the $250 figure today. Prices traded as high as $253.59 in today’s trading session, before a retracement took BTC down to $251.84 dollars per coin. But this new rally has yet to translate into gains for other crypto-currencies. While Litecoin is trending higher, it still hasn’t broken the crucial $3.19 resistance. And both Peercoin and Namecoin remain firmly stuck in the middle of their respective ranges.
Peercoin Still in a 3 Cents Congestion
Alternative crypto-currency Peercoin is still trading within the 3 Cents range outlined in our article last week. The top of this congestion area stands at $0.393 while the bottom is at $0.363. As we can see on the chart below, PPC/USD is currently trading in the middle of its range.
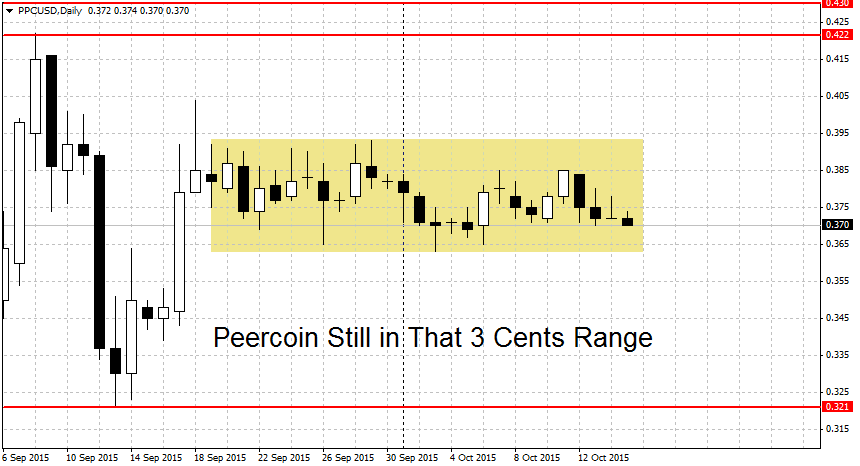
What’s next for Peercoin? With bitcoin now in rally mode, a break to the upside should be the more likely scenario. But this is far from a sure bet, as we can see above PPC/USD has fallen in 3 of the last 4 sessions. During the same timeframe bitcoin has advanced by $9 dollars or 3.6 percent.
A decisive break above 41 cents may start a new rally for Peercoin. Soon after we find a resistance at the former swing high at $0.422 followed by important support now turned resistance at $0.43. A clearing of this area should exacerbate the gains. On the lower end a break below the 32 cents figure may start a new downtrend.
Namecoin Within 1.1 Cent Last Week
Not much has changed for NMC/USD since last week. The pair remains stuck in a wider congestion area between $0.332 and $0.41 dollars per coin. In the past seven days Namecoin traded in a very narrow range between $0.363 and $0.374. Highly constricted periods like these are usually followed by breakouts and trends.
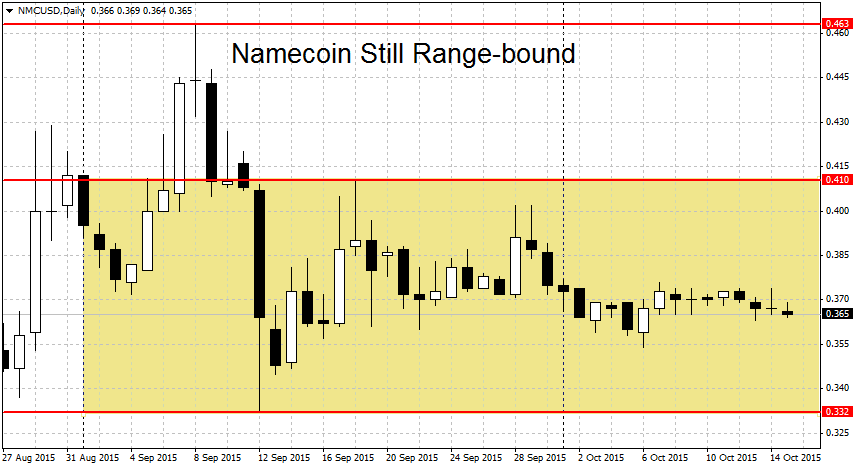
The potential breakout bounds for NMC stand at $0.41 and $0.33. A clean break beyond either price extreme may jump-start a new trend. Above $0.41 we have important resistance level at the previous swing high of $0.463, followed by the round 50 cents figure. On the downside we have several support levels below the breakdown point at $0.30, $0.286 and $0.274. Due to this caution is advised. Another reason to exercise more caution on the downside is bitcoin’s rally.
Bitcoin Now in Rally Mode
Bitcoin finally broke above the $250 figure today, entering into a new rally. The next resistance to watch out for is the $269 swing high. A break above here may lead to extended gains.
FXOpen offers the world's most popular cryptocurrency CFDs*, including Bitcoin and Ethereum. Floating spreads, 1:2 leverage — at your service (additional fees may apply). Open your trading account now or learn more about crypto CFD trading with FXOpen.
*Important: At FXOpen UK, Cryptocurrency trading via CFDs is only available to our Professional clients. They are not available for trading by Retail clients. To find out more information about how this may affect you, please get in touch with our team.
This article represents the opinion of the Companies operating under the FXOpen brand only. It is not to be construed as an offer, solicitation, or recommendation with respect to products and services provided by the Companies operating under the FXOpen brand, nor is it to be considered financial advice.
Stay ahead of the market!
Subscribe now to our mailing list and receive the latest market news and insights delivered directly to your inbox.


Latest articles

DAX 40: consolidation amid technology sell-off
A wave of selling in the technology sector that emerged earlier this week has weighed on European equities. The trigger was investor concern over the profitability of large-scale debt-funded investments by major US tech companies in AI infrastructure. The Nasdaq

Euro Hits Fresh Yearly Lows Amid Dovish ECB Signals
The euro remains under pressure following weak macroeconomic data from the euro area and fresh signals that the European Central Bank is prepared to maintain a more accommodative monetary policy stance. Data released yesterday pointed to a deterioration in business

Pound at Key Levels: Markets Assess Impact of Political Uncertainty in the UK
The British pound remains under pressure following increased political uncertainty in the United Kingdom triggered by the Prime Minister’s resignation. Investors are assessing potential shifts in the political and economic policy outlook after the head of government stepped down,