


Market Analysis: Markets Awaiting US Inflation Data
FXOpen
Yesterday, the major currency pairs were trading in fairly narrow ranges. Positive data on the US producer price index for September and the publication of the latest Fed minutes did not contribute to increased volatility in the market. Most likely, investors are expecting today's inflation data in the US. If the indicator is at the forecast level or even lower, this could lead to a change in the Fed's monetary policy, which in turn could contribute to the start of a medium-term downward impulse for the US dollar. Conversely, high inflation could force officials to keep rates high for a long time, which could trigger a new wave of greenback growth.
USD/CAD
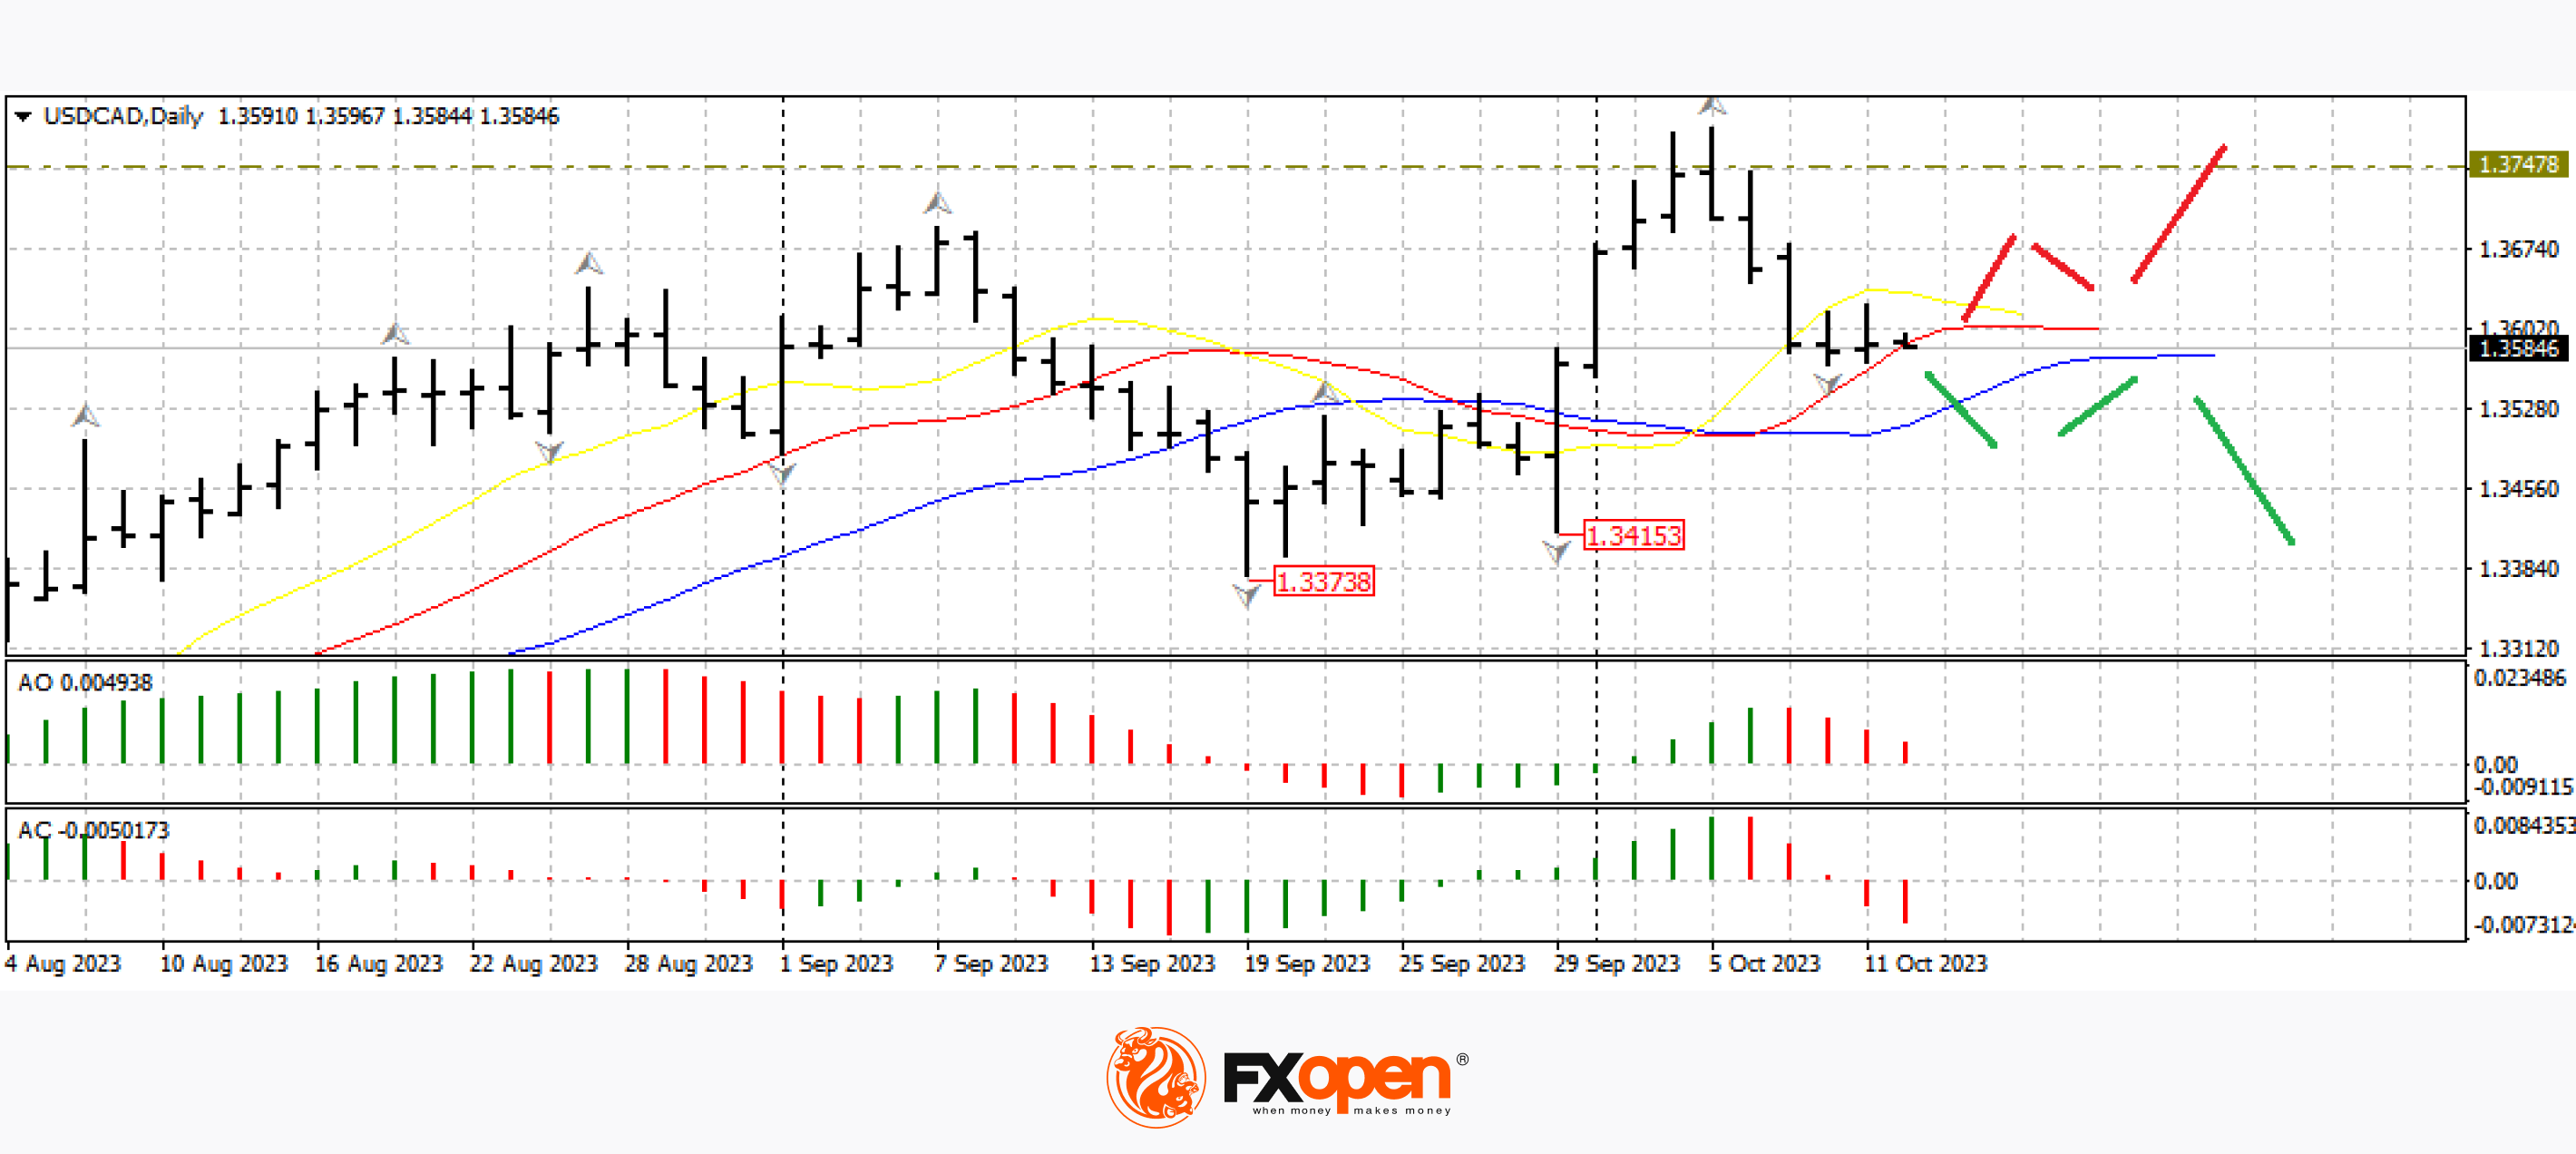
After a sharp decline last week, the USD/CAD pair found strong support in the 1.3600-1.3570 range. At these marks, there are alligator lines on the daily timeframe. Price behaviour at a given location can provide more clues as to the future direction of the pair. A sharp rebound from current levels could return the price back to 1.3700-1.3780. But a move below 1.3520 may contribute to a renewed decline in the direction of lower fractals at 1.3415 and 1.3370.
In addition to inflation data, today at 15:30 GMT+3, it is worth paying attention to the weekly data on applications for unemployment benefits in the United States. Also, at 18:00 GMT+3, weekly data on crude oil inventories will be released.
GBP/USD
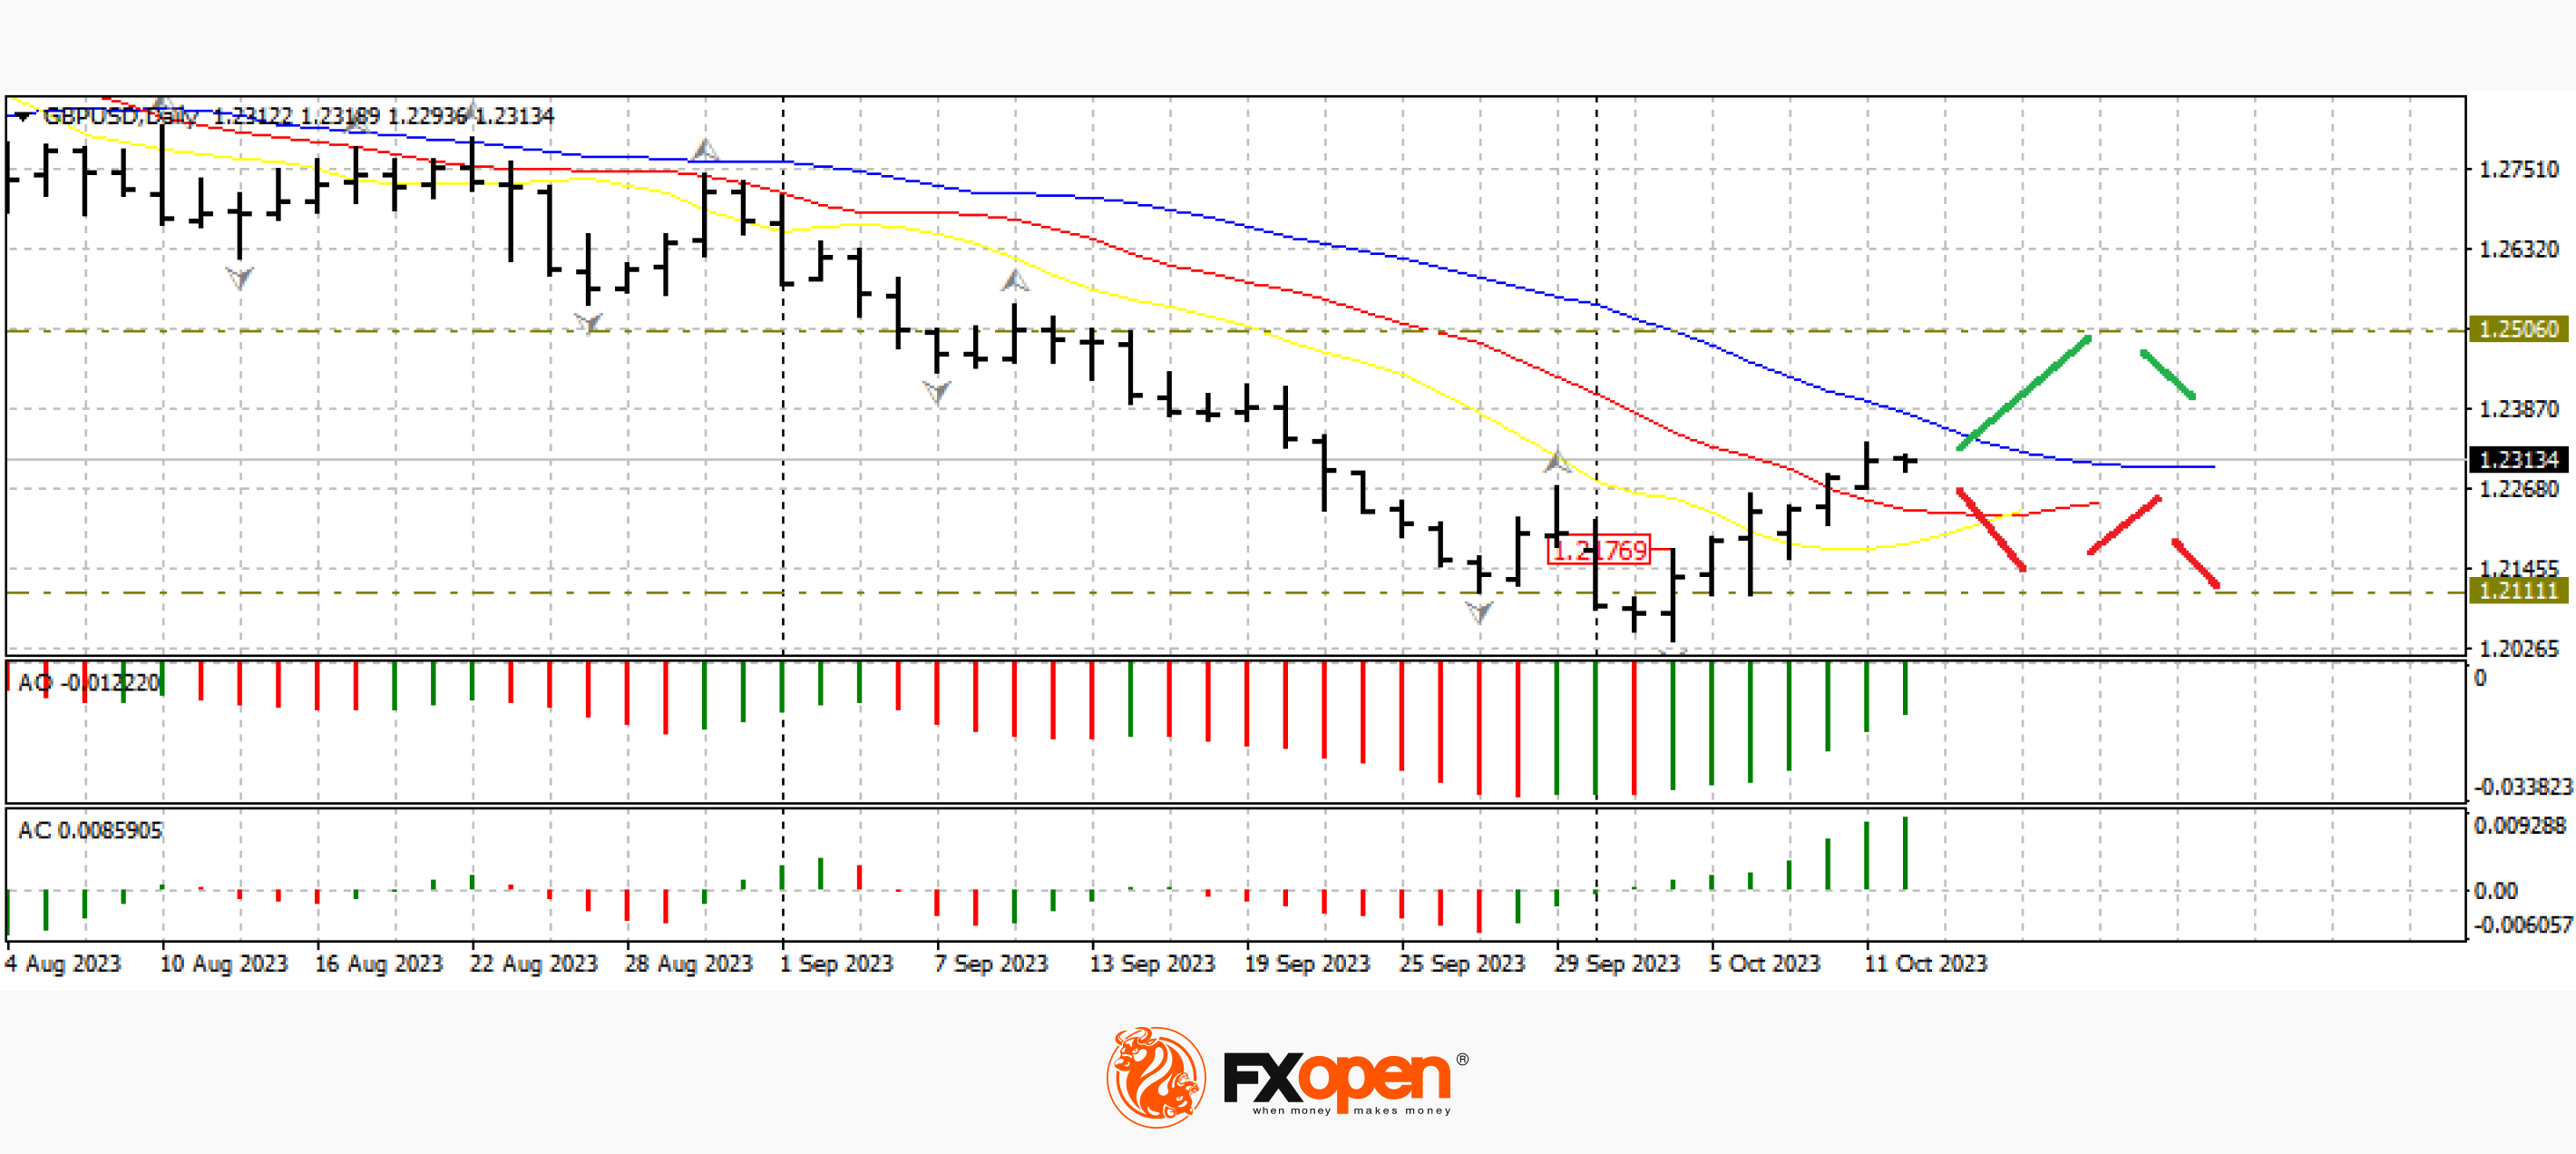
The GBP/USD pair showed moderate growth yesterday. Buyers retested 1.2300 and strengthened above this level, but so far, there has been no confident upward dynamics.
Today at 11:30 GMT+3, we are waiting for the publication of research on the Bank of England’s credit conditions. A little later, data on the main Thomson Reuters/Ipsos consumer sentiment index (PCSI) in the UK for October will be released.
XAU/USD
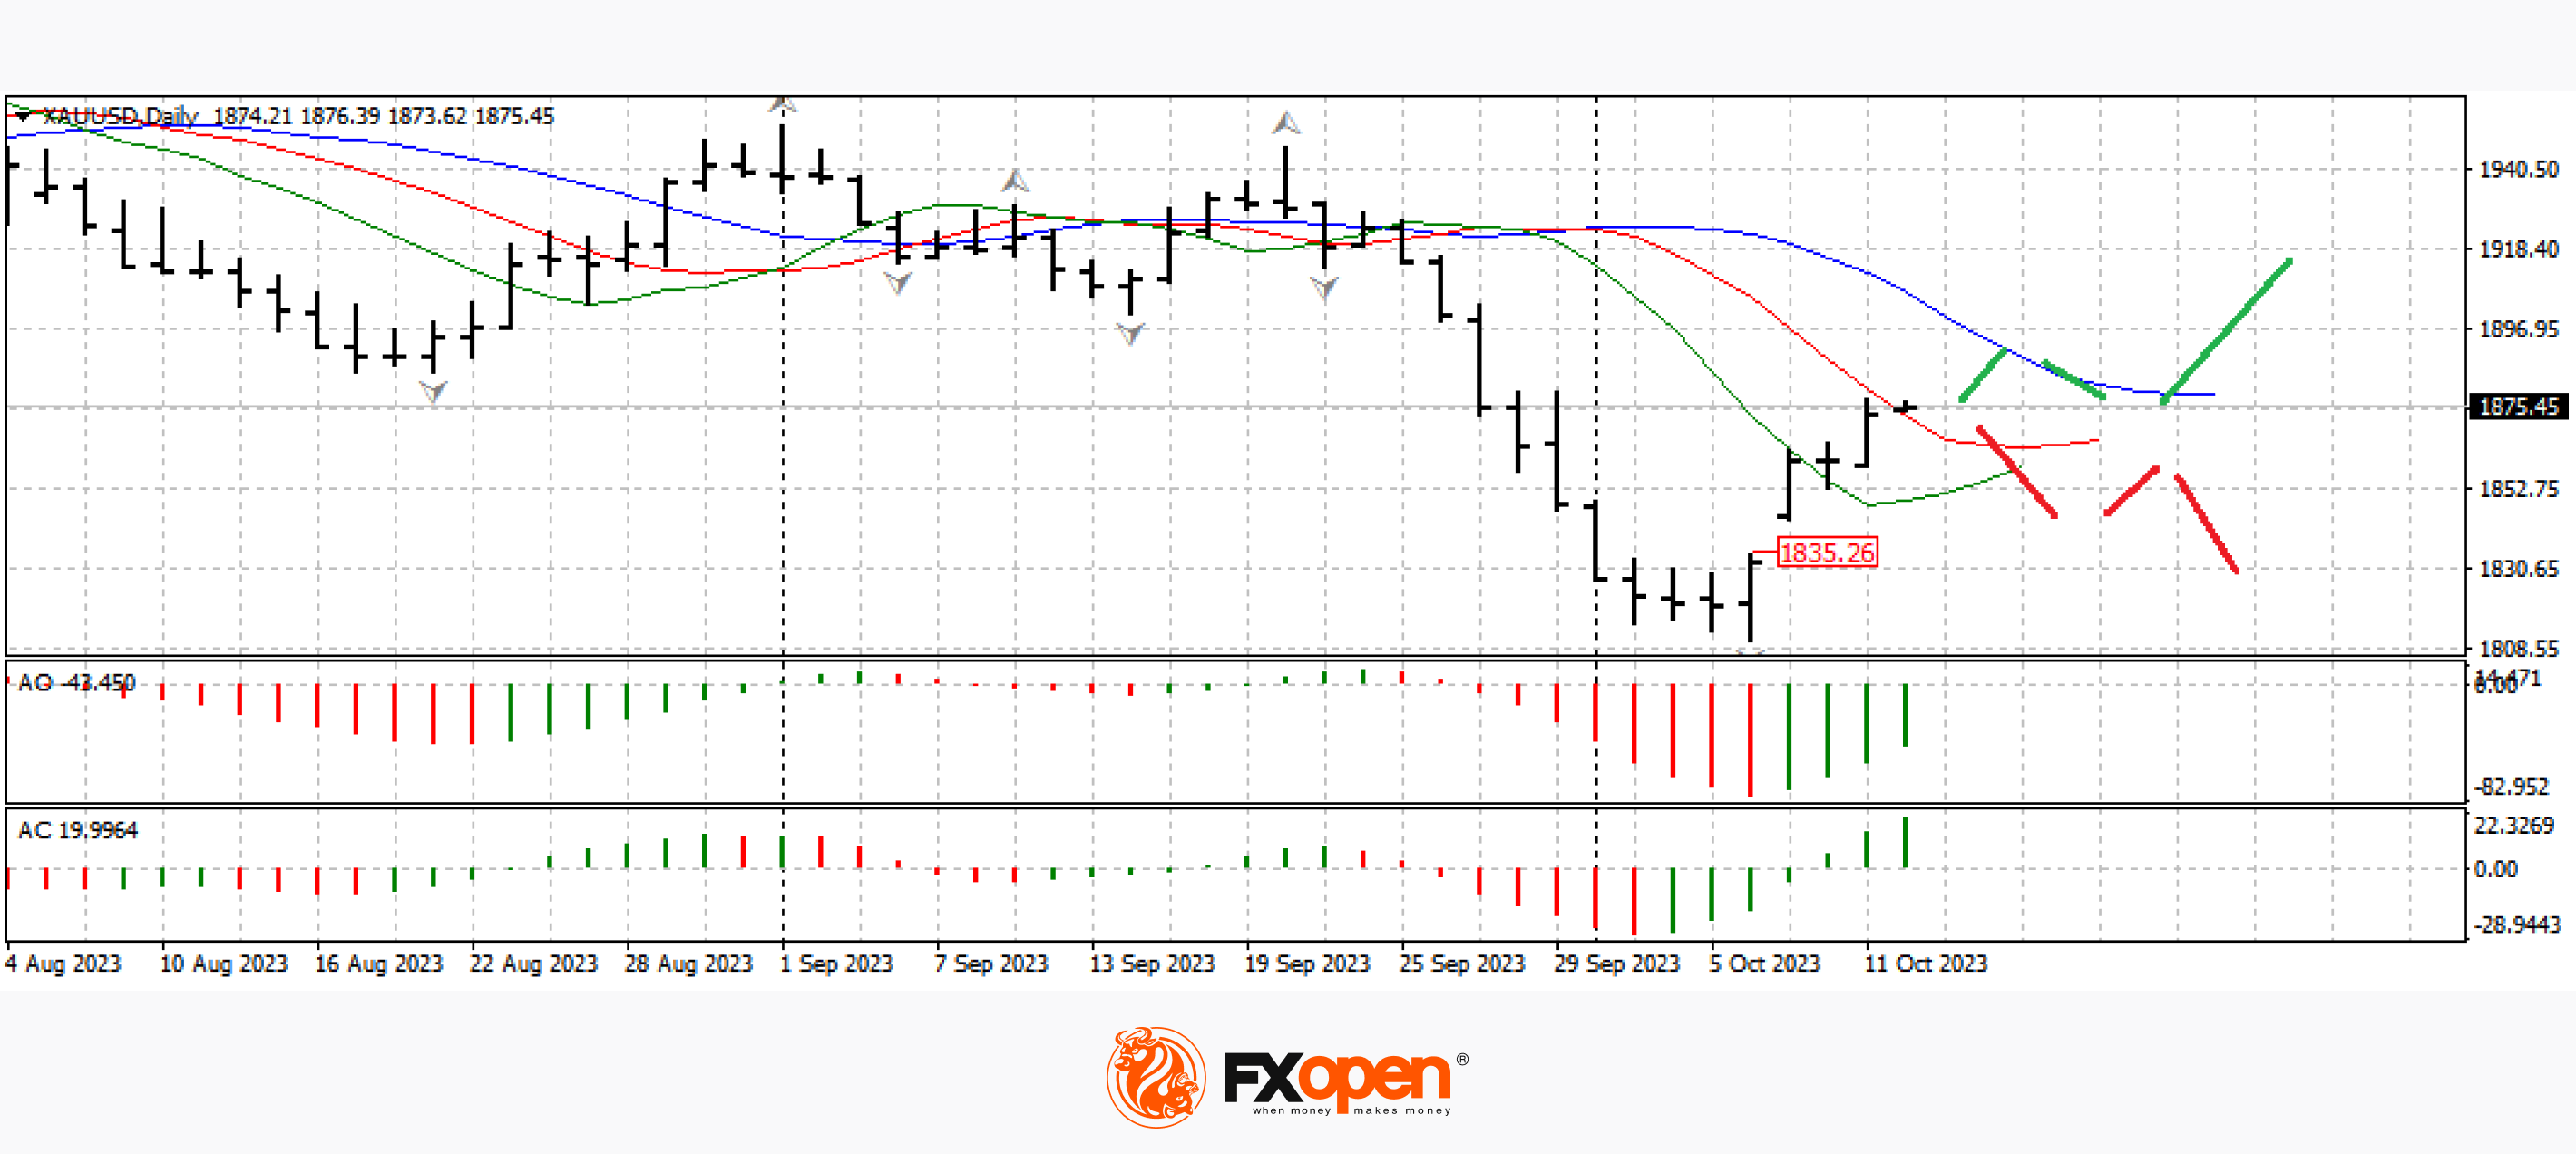
The temporary weakness of the American currency and the aggravation of the geopolitical situation in the world contributed to a sharp pullback in precious metals. Using the chaos trading strategy, in the XAU/USD pair, we observe the development of a reversal bullish bar from October 6. At the moment, the price is trading around the intertwined alligator lines on the daily timeframe. A move above 1,890.00-1,900.00 could contribute to the resumption of medium-term growth. A rebound from current levels could return the price to 1,830.00-1,810.00.
Trade over 50 forex markets 24 hours a day with FXOpen. Take advantage of low commissions, deep liquidity, and spreads from 0.0 pips (additional fees may apply). Open your FXOpen account now or learn more about trading forex with FXOpen.
Start trading commodity CFDs with tight spreads (additional fees may apply). Open your trading account now or learn more about trading commodity CFDs with FXOpen.
This article represents the opinion of the Companies operating under the FXOpen brand only. It is not to be construed as an offer, solicitation, or recommendation with respect to products and services provided by the Companies operating under the FXOpen brand, nor is it to be considered financial advice.
Stay ahead of the market!
Subscribe now to our mailing list and receive the latest market news and insights delivered directly to your inbox.


Latest articles

AI Valuations Are Back in the Spotlight
Artificial intelligence remains the dominant investment theme of 2026, but investors are increasingly questioning whether AI stock valuations are keeping pace with reality.
💰 Big Tech continues to invest at an unprecedented scale, with hyperscaler AI spending projected to exceed $800

AUD/CAD: Months of Indecision — Is a Breakout Finally Coming?
The Australian dollar has clawed back most of its end-of-June losses, when it touched three-month lows against the greenback amid escalating Middle East tensions. Since then, sentiment has improved: the RBA's Assistant Governor Sarah Hunter signalled the board stands ready

USD/JPY: Battling at the Top of the Triangle
On 3 July, Japan's Finance Minister, Satsuki Katayama, stated that the Ministry of Finance remains in close contact with US authorities regarding developments in USD/JPY as the yen traded near its weakest level in almost 40 years. Similar verbal