


FXOpen

Navigating flat markets can often feel like sailing a ship with no wind. Yet, one strategy for flat trading, the Rubber Band, aims to change this perception by offering traders a disciplined approach to such conditions. Dive in to discover how to optimise your trading when the markets lack a clear trend.
The Reality of Flat Markets
In financial markets, a prevalent yet often overlooked fact is that assets often trade within a flat or sideways range about 70% of the time. Despite this, a significant portion of trading strategies is tailored to trending markets. This mismatch means traders are potentially neglecting a vast landscape of trading opportunities.
The dearth of specialised strategies for flat markets translates to untapped potential for both novice and experienced traders. By focusing only on trending markets, traders are essentially leaving money on the table and underutilising 70% of available trading scenarios.
The Basics of the Rubber Band Trading Strategy
The Rubber Band trade strategy is a trading approach designed specifically for those periods when the market is moving sideways, lacking a clear upward or downward trend. The strategy relies on a trio of commonly used technical indicators: Moving Averages (MA), Bollinger Bands (BB), and the Relative Strength Index (RSI). Here's how it works:
Moving Averages (MA)
Traders often use two moving averages with different periods (usually 20 and 50). They act as a flat market indicator: when these averages intersect or move in parallel, the market is often considered flat.
Bollinger Bands (BB)
Consisting of an upper, middle, and lower band, Bollinger Bands help traders understand price volatility. The middle band is typically a 20-period MA.
Relative Strength Indicator (RSI)
This momentum oscillator measures the speed and change of price movements, generally on a scale of 0 to 100. Traders often modify the RSI levels to 35 and 65 for this strategy to better identify overbought or oversold conditions.
Identifying a Flat Market
Identifying a flat market is crucial for the effective application of the Rubber Band trade strategy. One approach involves the use of moving averages. When two moving averages, often the 20- and 50-period, intersect or run parallel, it frequently indicates a flat market.
Another method entails drawing horizontal lines through at least two price maximums and minimums to form a horizontal corridor. Utilising both approaches in conjunction can strengthen the signal, increasing the reliability of identifying a sideways market.
Indicator Settings
For the Rubber Band strategy, traders typically set up indicators on different timeframes. On a 4-hour chart, two moving averages with periods of 20 and 50 are inserted. This is to check whether the market is flat or not. On a 1-hour chart, Bollinger Bands are added with default settings, along with the Relative Strength Indicator, adjusting its levels to 35 and 65.
Each of these indicators is available in FXOpen’s free TickTrader platform. Head over there to get started with this strategy in minutes.
Long Order Execution
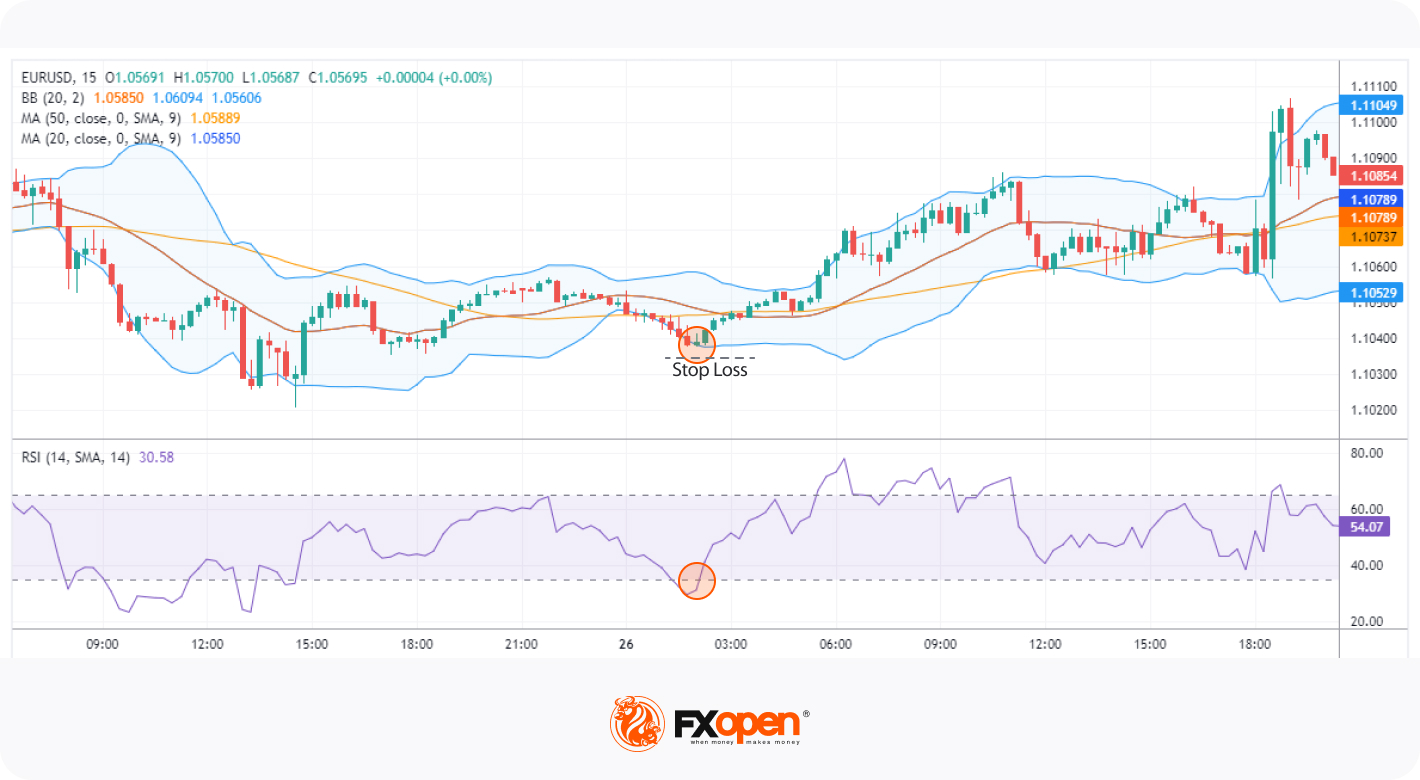
When entering long, this setup is often employed:
Entry
- Confirm that the market is flat on the 4-hour chart.
- On the 1-hour chart, wait for the price to break below the lower line of the Bollinger Bands. Look for the RSI to move towards or below the 35 level.
- Optionally, seek a reversal signal on a 15-minute chart, such as a morning star or a bullish engulfing pattern.
Stop Loss
- Typically, traders set the stop loss just below the signal candle.
Take Profit
- One common take-profit level is at the middle line of the Bollinger Bands, which serves as an initial target.
- For those looking to maximise gains, a second take profit can be set at the upper end of the Bollinger Bands.
Short Order Execution
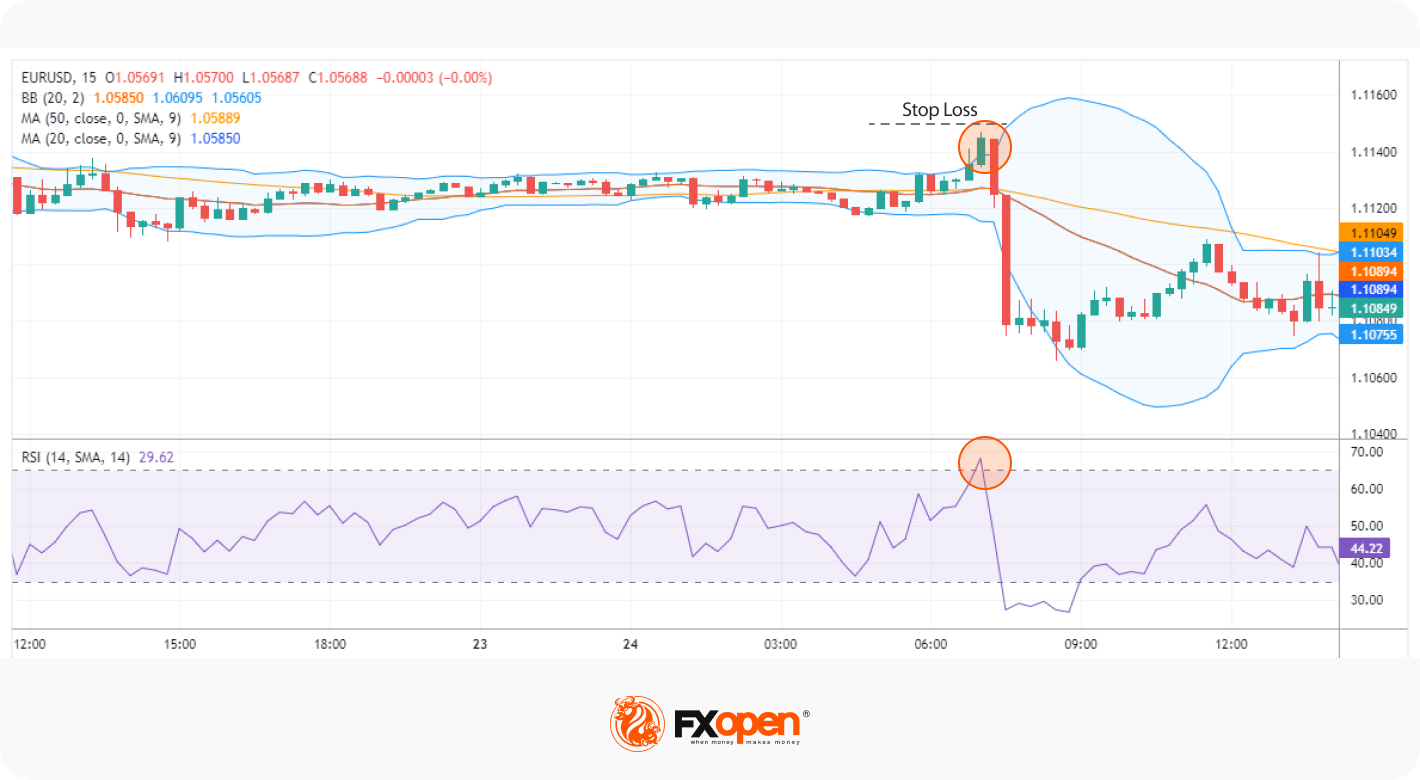
On the other hand, traders use these criteria for short orders:
Entry
- Verify the market's flat nature on the 4-hour chart.
- Shift focus to the 1-hour chart and observe if the price moves above the upper Bollinger Band. Watch the RSI as it approaches or exceeds the 65 level.
- Optionally, use a 15-minute chart to identify a reversal signal, such as an evening star or a hanging man pattern.
Stop Loss
- Traders often place the stop loss slightly above the signal candle.
Take Profit
- A widely used initial take-profit point is the middle line of the Bollinger Bands.
- For traders looking to capture additional upside, a secondary take-profit point can be the lower Bollinger Band.
The Bottom Line
In summary, the Rubber Band trade strategy offers a systematic approach for traders looking to navigate the complexities of flat markets. By employing well-timed entry points, along with strategic stop losses and take profits, traders can unlock a wealth of opportunities. To test this strategy and modify it in accordance with your trading approach, consider opening an FXOpen account. When you do, you’ll gain access to hundreds of markets to put your newfound knowledge to the test. Good luck!
This article represents the opinion of the Companies operating under the FXOpen brand only. It is not to be construed as an offer, solicitation, or recommendation with respect to products and services provided by the Companies operating under the FXOpen brand, nor is it to be considered financial advice.
Stay ahead of the market!
Subscribe now to our mailing list and receive the latest market news and insights delivered directly to your inbox.

Latest from Trader’s Tools
Latest articles

Weekly Market Wrap With Gary Thomson: Nasdaq, EUR/USD, USD/CHF, Brent Crude Oil, Googl Shares
Get the latest scoop on the week's hottest headlines, all in one convenient video. Join Gary Thomson, the COO of FXOpen UK, as he breaks down the most significant news reports and shares his expert insights.
- Nasdaq Composite: Worst Session

Analysis of AUD/USD: Exchange Rate Falls to Early May Low
As indicated by the 4-hour AUD/USD chart today:
→ the rate fell below 0.652, a level last seen on May 2;
→ the RSI indicator dropped below 15, a level last seen during the panic over the spread of COVID-19

Analysis of AMZN Stock: Price at 1.5-Month Low
As shown in the AMZN chart, the stock price dropped below:
→ the psychological level of $180;
→ the mid-June interim low.
The last time AMZN traded below $180 was in early June.
Thus, AMZN has faced sell-offs, similar to other tech