


Trading Strategies for Different Liquidity Conditions
FXOpen

Navigating the financial markets requires a keen understanding of liquidity conditions and their impact on trading strategies. From the bustling activity of high-liquidity markets to the more unpredictable nature of low-liquidity environments, each presents unique challenges and opportunities. This article explores three trading strategies tailored to different liquidity scenarios.
What Are Liquidity Conditions?
Liquidity conditions in financial markets refer to the ease with which assets can be bought or sold at stable prices. Essentially, it's about how quickly and efficiently a market can match buyers and sellers. High liquidity is characterised by a high volume of trading activity, where transactions can be executed swiftly without significantly impacting the asset's price. High liquidity conditions examples include major forex pairs like EUR/USD, which typically have plenty of buyers and sellers at any given price level.
Conversely, low liquidity markets might involve less frequently traded assets, like certain small-cap stocks, where finding a buyer or seller takes longer, potentially leading to more significant price fluctuations for each trade.
What Is a Liquidity Sweep?
A liquidity sweep occurs when large orders are placed to consume available liquidity at a certain price level. Liquidity in this context is often found in the form of traders’ stop-loss and stop-entry orders. This strategy is employed to capitalise on the temporary supply and demand imbalance, aiming to move the price to more favourable levels to facilitate a larger trade. It's a tactic seen across various liquidity conditions, used to manipulate the market's available liquidity for strategic advantage.
Below, we cover three trading strategies for different liquidity conditions, including a liquidity sweep strategy. To gain the best understanding of how they work, consider following along in FXOpen’s free TickTrader platform.
High Liquidity: Trend Following
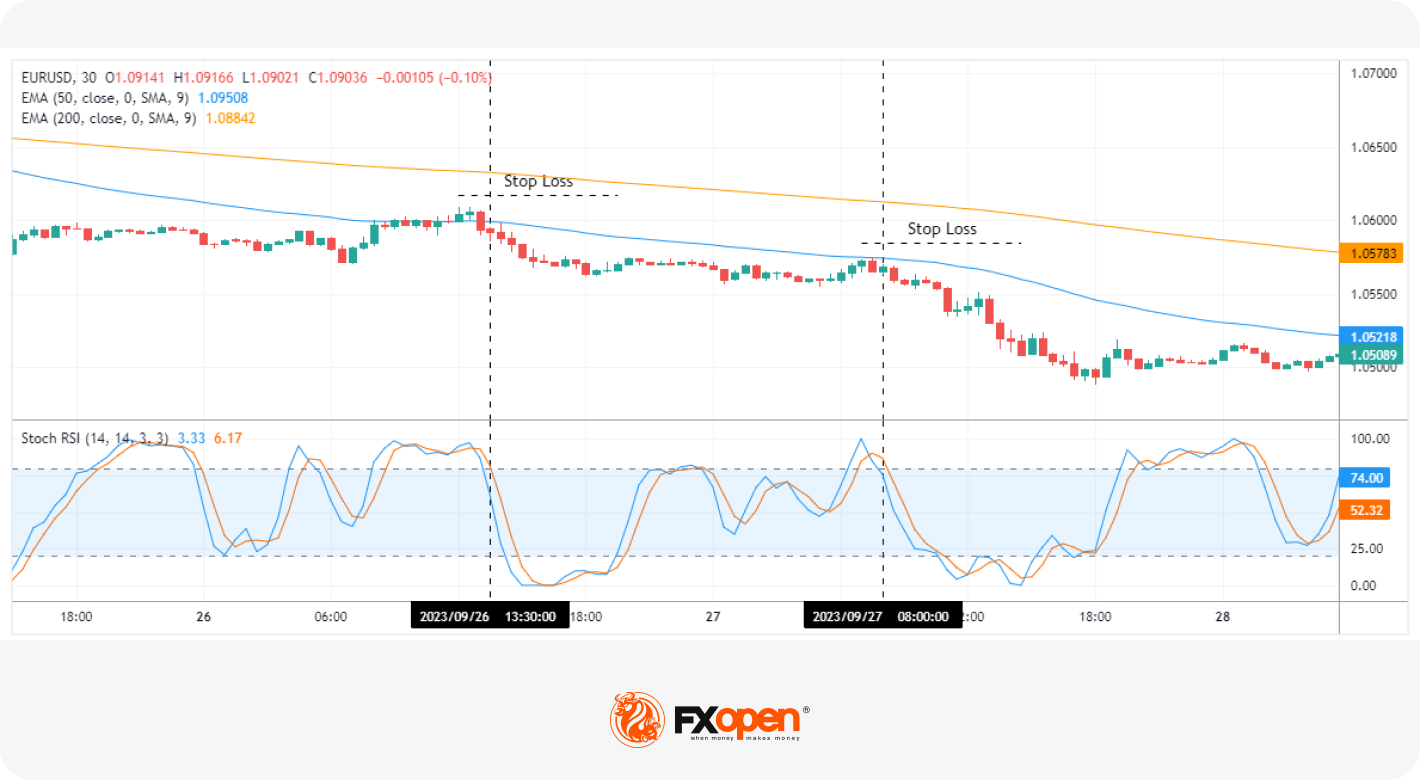
In high liquidity conditions, where large volumes of trades occur and price movements are considered to be more predictable, trend-following strategies often thrive. These conditions may enable clearer identification of market trends and smoother execution of trades. Among various trend-following methods, a strategy that utilises two Exponential Moving Averages (EMAs) and the Stochastic RSI indicator might be effective.
Entry
- Traders may look for a scenario where the price is consistently above or below both the 50- and 200-period EMAs, which usually signifies a strong trend.
- A pullback to the 50-period EMA may present an optimal entry opportunity.
- When the Stochastic RSI indicates an overbought or oversold condition and then closes back below 80 or above 20, it may reflect a potential entry point following the pullback.
Stop Loss
- For a more aggressive stance, traders may set stop losses near the nearest swing point. Alternatively, a more conservative approach might involve placing stop losses beyond the 200 EMA, offering a larger cushion against market volatility.
Take Profit
- Traders may take profits at established support or resistance levels or when the Stochastic RSI moves into the opposite condition, signalling a potential trend reversal.
- Another approach could be to exit the trade upon observing the 50-period EMA crossing the 200-period EMA in the direction opposite to the current trend.
Low Liquidity: Reversion
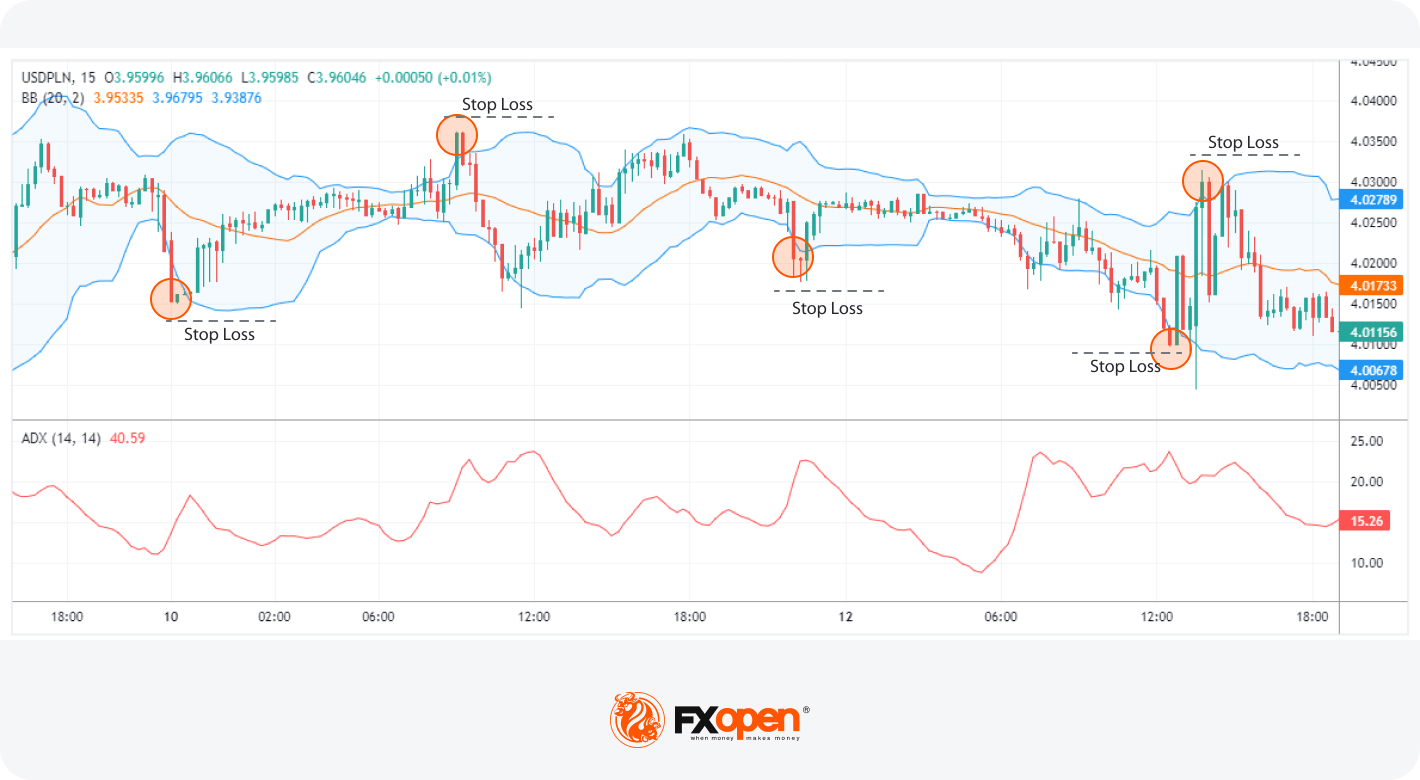
In markets characterised by low liquidity, assets often exhibit a propensity to revert, particularly in non-trending conditions. This tendency forms the basis of this low-liquidity trading strategy. This particular strategy leverages the short-term price fluctuations often seen as price bounces in between Bollinger Bands.
Entry
- Traders may use the Average Directional Index (ADX) to identify non-trending conditions. A reading below 25 on the ADX typically indicates a lack of a strong trend.
- With standard settings on Bollinger Bands, traders often look for price closing outside of the bands while the ADX is below 25. This scenario may increase the likelihood of price reverting to the middle line of the Bollinger Bands.
- Traders may enter on the close of the candle that closes outside of the Bollinger Band, anticipating a move back towards the .
Stop Loss
- The theory states that traders set stop losses just beyond the high or low of the candle that triggered the entry. However, some may prefer to choose a wider stop loss, given the more extreme price movements of less liquid markets.
Take Profit
- Profit-taking may be done at the middle line of the Bollinger Bands. This level often acts as a mean to which the price is expected to revert.
All Types of Liquidity: Liquidity Sweep Trading
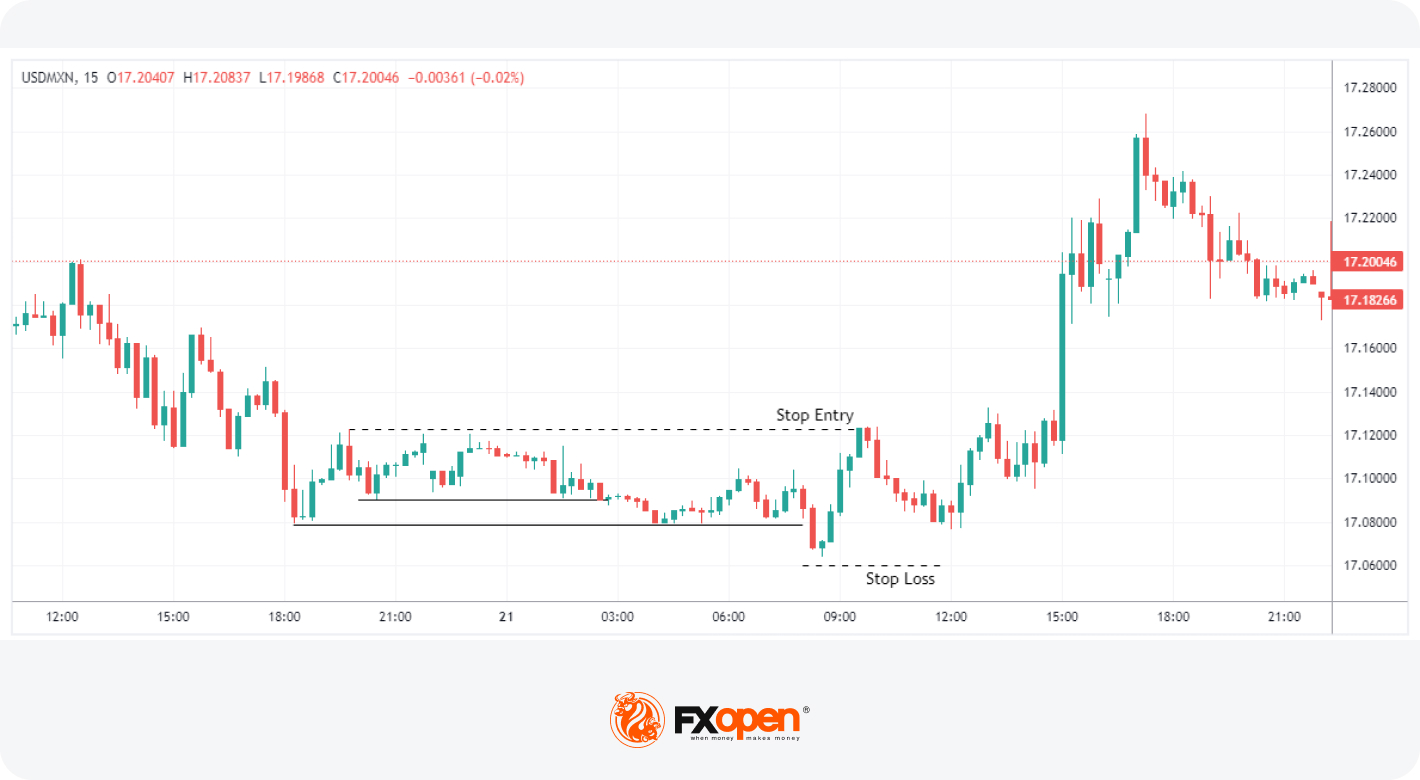
Liquidity sweep trading is a versatile strategy applicable across different liquidity conditions. It uses the concept of a liquidity grab, meaning the strategy capitalises on the market's hunt for liquidity. This occurs typically around key support and resistance levels, where orders tend to accumulate above and below swing points. The essence of this strategy is to identify and exploit the market's tendency to temporarily break these levels to capture liquidity before reversing direction.
Entry
- Traders often look for roughly equal highs or lows being formed, usually around a known support or resistance level.
- A crucial aspect is to watch for these highs and lows being breached, which might initially appear as a breakout.
- If the sharp breakout move is quickly retraced, ideally indicated by engulfing candles, it suggests a potential liquidity sweep.
- Traders may set a stop entry just beyond the high or low of the initial range, anticipating the market's return to capture the real breakout after the sweep.
Stop Loss
- Traders may place a stop loss above or below the sharp breakout point. This could help in managing the risk associated with the unpredictability of liquidity sweeps.
Take Profit
- Profits may be taken at the closest support or resistance level. This may allow traders to capitalise on the reversal movement following the liquidity grab.
The Bottom Line
Understanding and adapting to different liquidity conditions is a key to effective trading. Whether it's capitalising on high liquidity markets with trend following, navigating the reversion in low liquidity scenarios, or strategically employing a liquidity sweep in various conditions, each approach offers unique opportunities. Want to practically apply these strategies and further your trading skills? Consider opening an account with FXOpen to explore a range of high and low-liquidity markets.
This article represents the opinion of the Companies operating under the FXOpen brand only. It is not to be construed as an offer, solicitation, or recommendation with respect to products and services provided by the Companies operating under the FXOpen brand, nor is it to be considered financial advice.
Stay ahead of the market!
Subscribe now to our mailing list and receive the latest market news and insights delivered directly to your inbox.


Latest articles

AUD/CAD: Months of Indecision — Is a Breakout Finally Coming?
The Australian dollar has clawed back most of its end-of-June losses, when it touched three-month lows against the greenback amid escalating Middle East tensions. Since then, sentiment has improved: the RBA's Assistant Governor Sarah Hunter signalled the board stands ready

USD/JPY: Battling at the Top of the Triangle
On 3 July, Japan's Finance Minister, Satsuki Katayama, stated that the Ministry of Finance remains in close contact with US authorities regarding developments in USD/JPY as the yen traded near its weakest level in almost 40 years. Similar verbal

Dow Jones (DJIA): Consolidation Beyond the Trend
Federal Reserve Chair Kevin Warsh testified before Congress on 14–15 July, reaffirming the Fed's commitment to bringing inflation back to target while providing no clear guidance on the future path of interest rates. Meanwhile, June inflation data came in