


How to Trade with the Stochastic RSI?
FXOpen
Dive into the world of advanced trading indicators with the Stochastic RSI. This potent tool, rooted in two well-known indicators, offers frequent entry and exit signals for traders. In this article, we will delve into how the StochRSI works, examine the Stochastic Oscillator vs the RSI, and explain how to use this tool in your trading.
What Is the Stochastic RSI?
The Stochastic Relative Strength Index, abbreviated to Stochastic RSI or just StochRSI, is a momentum oscillator primarily used to identify overbought or oversold conditions in financial markets. Developed by Tushar Chande and Stanley Kroll, this tool represents an advancement of the traditional relative strength index (RSI) and the stochastic oscillator, thus gaining its name – Stochastic RSI.
In the world of trading, the StochRSI offers valuable insights for traders by gauging the speed and change of price movements. It oscillates between zero and one, with values above 0.8 (or 80, depending on the charting software) generally considered overbought conditions and those below 0.2 (or 20) deemed oversold conditions.
This tool, with its basis in both the stochastic oscillator and RSI, offers a refined method for detecting changes in momentum ahead of price. As such, it is often used to predict potential reversals, offering traders the opportunity to identify prime entry and exit points.
How Is the Stochastic RSI Calculated?
To comprehend the mechanics of the StochRSI, we first need to understand its foundation – the original RSI and the Stochastic oscillator.
First, the standard RSI for the chosen period is calculated. This calculation involves finding the average gain or loss over this period.
RSI = 100 - [100 / (1 + (Average of n periods closes up / Average of n periods closes down))]
Here, "n" typically represents 14 periods. The RSI moves between zero and 100, providing insights into the strength and speed of a price movement.
Second, the StochRSI is calculated. This involves determining where the RSI stands relative to its range over the chosen period.
Stochastic RSI = [(Current RSI - Lowest RSI Value in Given Period) / (Highest RSI Value in Given Period - Lowest RSI Value in Given Period)]
This results in a value between 0 and 1, which is then usually expressed as a number between 0 and 100.
The StochRSI inherits the sensitivity of the Stochastic oscillator, making it more volatile than the regular RSI. Hence, it's a favourite among traders who prefer an indicator that provides more frequent signals.
Thankfully, you don’t need to perform this calculation yourself. Hop on FXOpen’s free TickTrader platform to get started with the StochRSI in minutes.
The best Stochastic RSI settings are down to the individual trader. You can change the length of RSI and Stochastic, smoothK and smoothD values. Generally speaking, a longer RSI or Stochastic length will make the indicator less responsive, with potentially fewer false signals. In contrast, a shorter lookback period will increase the number of opportunities generated but also may boost the number of false positives.
Comparing RSI and Stochastic
Trading can often resemble the art of juggling, especially when using complex indicators. Let's break down the intricacies of the RSI, Stochastic, and StochRSI to appreciate their differences and similarities.
RSI vs Stochastic
When comparing the Stochastic vs RSI, it’s important to note that they both identify overbought and oversold conditions, but their sensitivity differs. RSI offers a less reactive measure of momentum, providing fewer but more reliable signals. On the other hand, the Stochastic oscillator is sensitive to price changes and may produce more trading opportunities, although it can generate occasional false signals.
RSI vs Stochastic RSI
So what about the Stochastic RSI vs RSI? While RSI measures price momentum, Stochastic RSI gauges the RSI's momentum. By applying the Stochastic formula to the RSI, the StochRSI is more responsive, giving traders more frequent cues that potentially highlight short-term market changes that RSI observers might miss.
Stochastic vs Stochastic RSI
While the Stochastic oscillator, which assesses an asset's closing price relative to its range, offers many trading pointers due to its high sensitivity, the StochRSI goes a step further. By comparing RSI to its recent range, StochRSI tends to yield more alerts and may give traders earlier entry or exit opportunities during swift market moves.
Trading With the Stochastic RSI Indicator
Now that we have understood the concept behind this tool, let’s examine the three main ways to trade it.
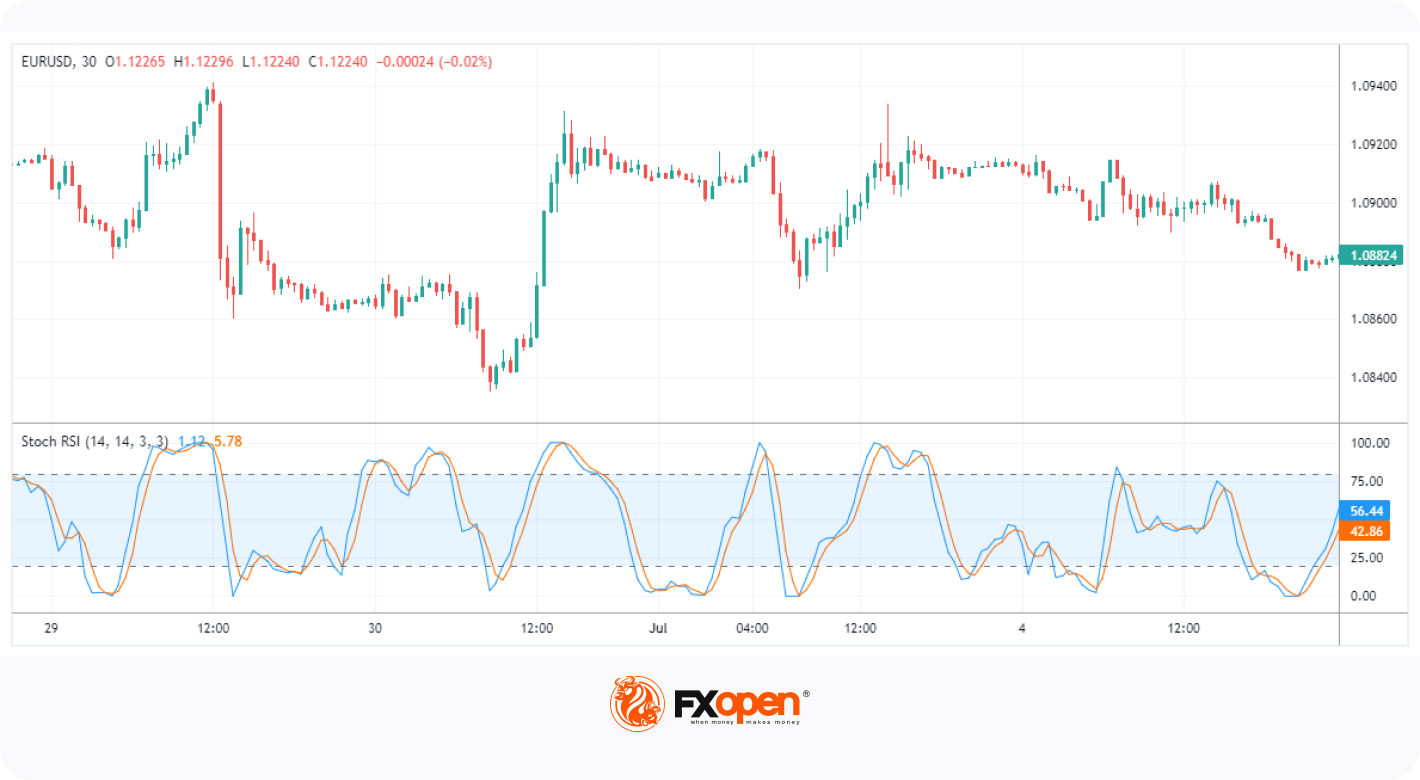
Overbought and Oversold Conditions
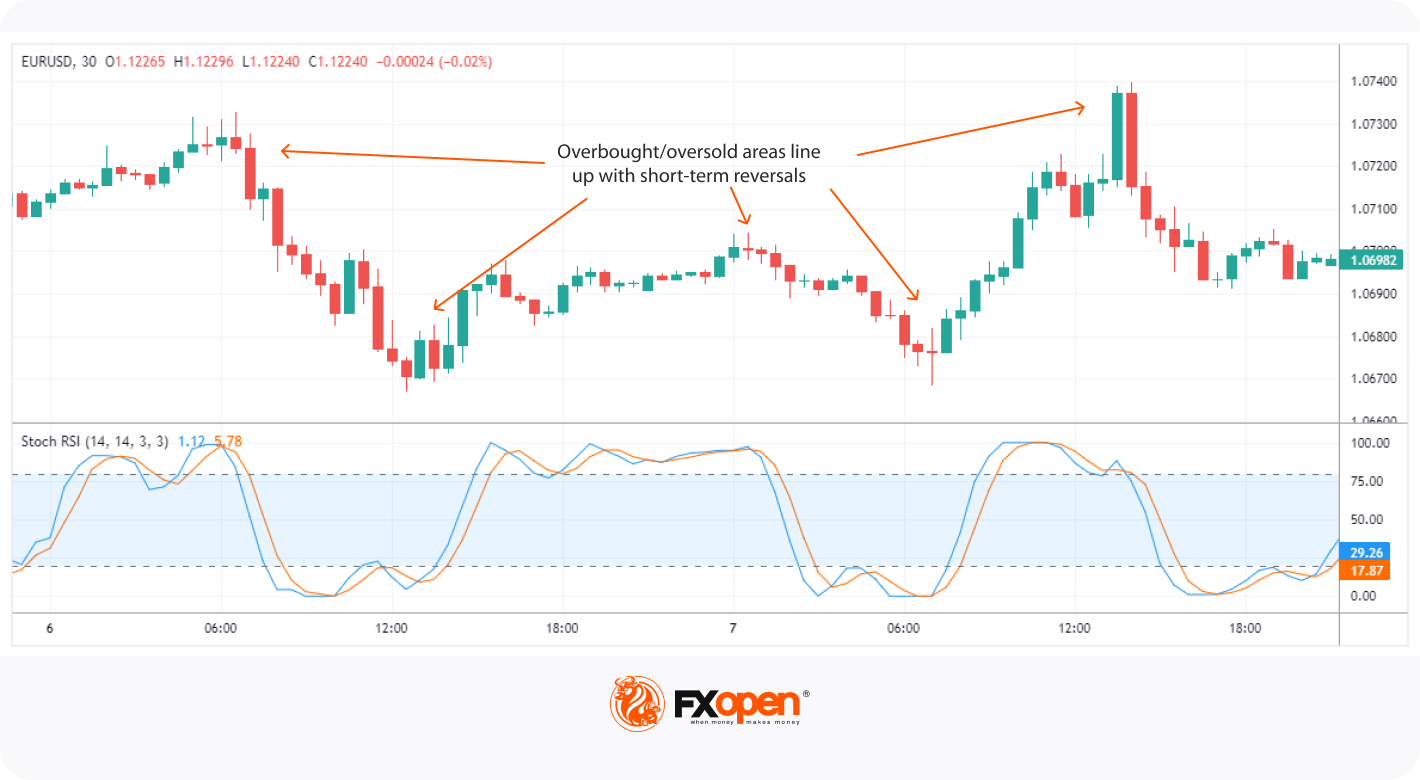
A fundamental aspect of trading with StochRSI involves interpreting overbought and oversold conditions. When the tool surpasses the 0.8 or 80 level, it typically indicates an overbought condition, which might be a sign for traders to sell or short. Conversely, when it dips below 0.2 or 20, the market might be oversold, often prompting traders to buy or go long. The theory states that traders shouldn’t open a position until the indicator leaves the overbought/oversold area.
Moves Above/Below the Midpoint
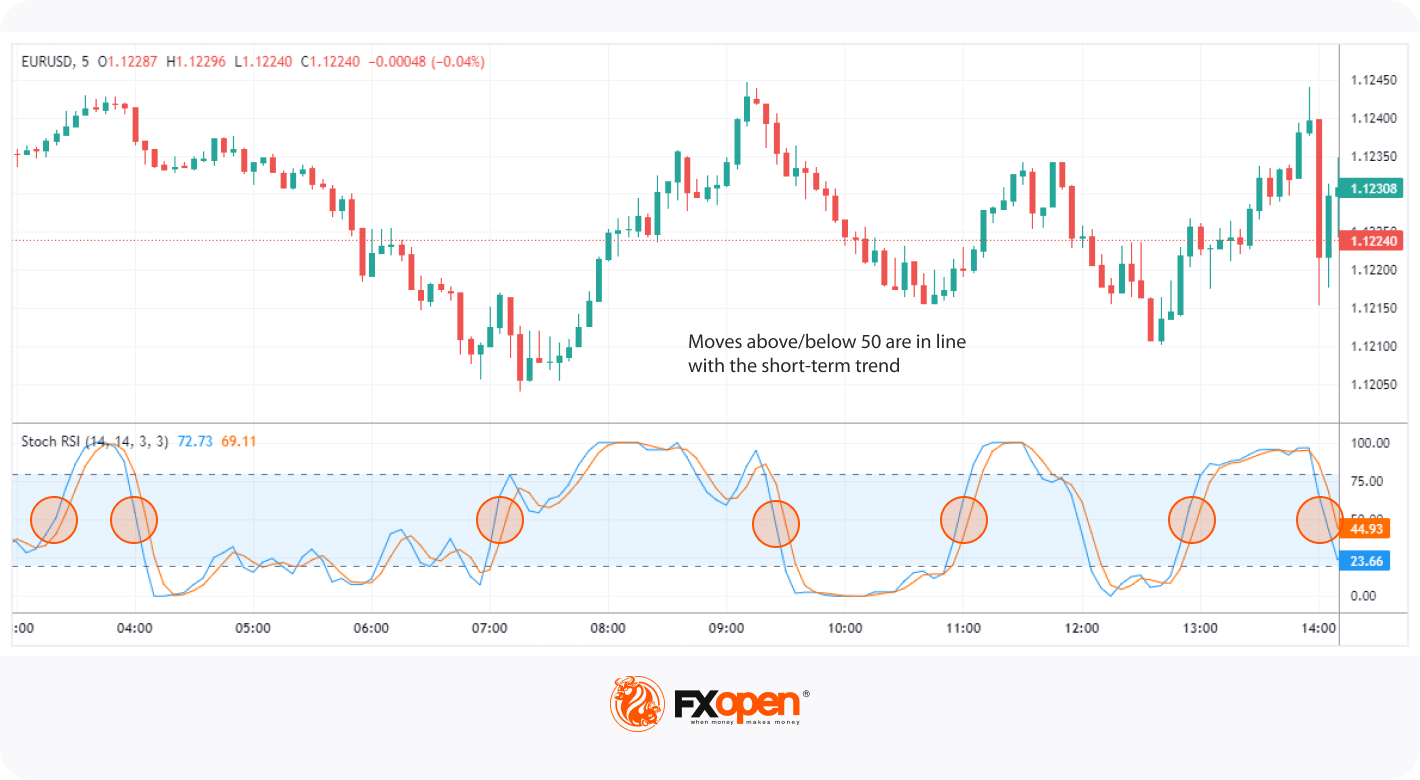
Movements above or below the midpoint can provide valuable trading opportunities as well. A move above the 0.5 or 50 level might indicate upward momentum, giving a potential buying signal. Conversely, a drop below this midpoint could imply a downward momentum, acting as a potential selling signal.
Divergences
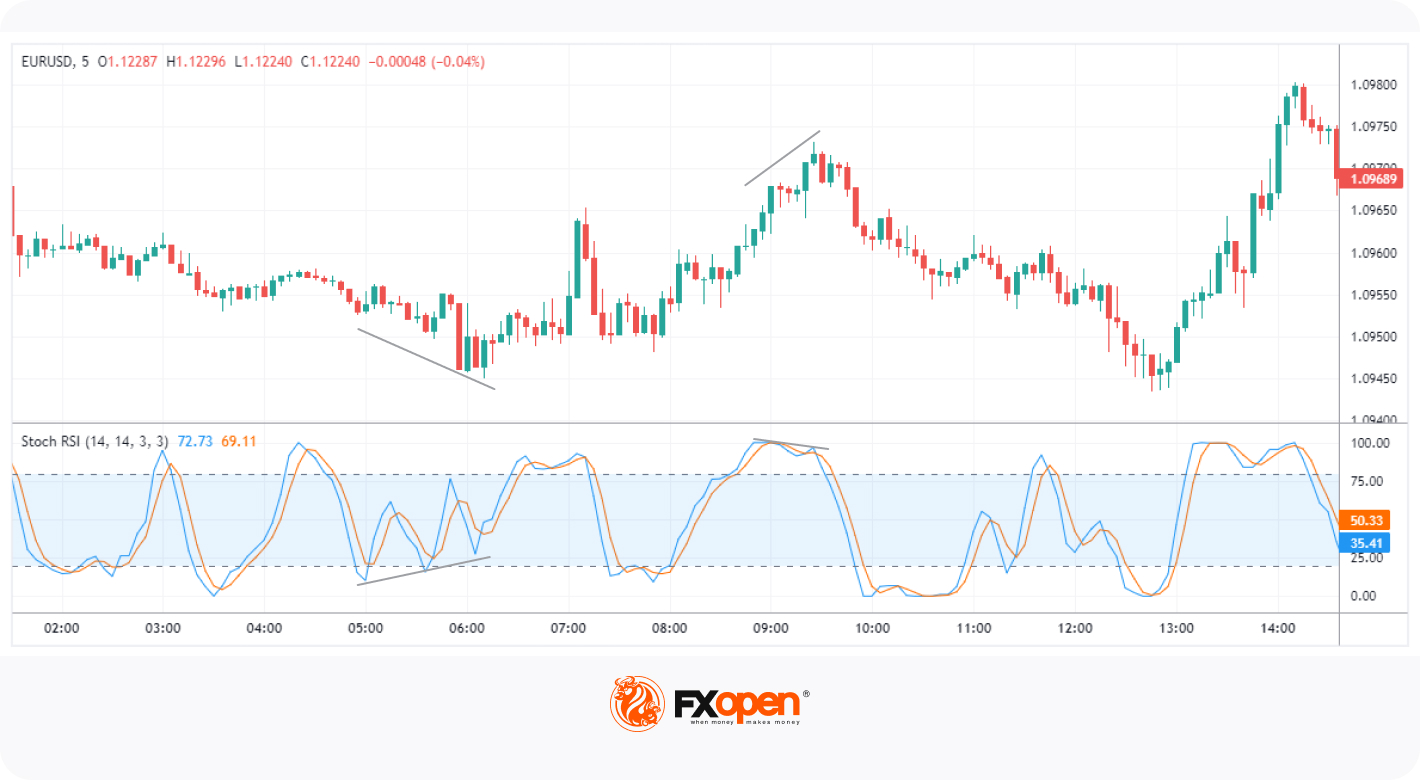
Divergences can be seen when the price and the StochRSI move in opposing directions. A bullish divergence happens when the price hits a lower low, but the indicator records a higher low. This discrepancy can signal an upcoming bullish reversal. Conversely, a bearish divergence occurs when the price reaches a higher high, while the tool hits a lower high, possibly indicating an upcoming bearish reversal. Such divergences can provide early warning signs of market shifts.
Advantages and Limitations of Stochastic RSI
The StochRSI offers the advantage of high sensitivity, detecting rapid price changes and providing more frequent signals. This allows traders to spot potential market reversals earlier.
However, this sensitivity can also be a limitation, leading to false alerts in volatile markets. Furthermore, given its relative complexity, the StochRSI can be easily misunderstood or misinterpreted, especially by traders with little experience.
The Bottom Line
The StochRSI is a powerful yet somewhat complex tool to add to your arsenal. It's ideal for traders seeking sensitive and frequent signals. However, this sensitivity can also lead to potential misinterpretations and false signals, so it’s important to get to grips with how it works before deploying it in live markets.
If you would like to practise your StochRSI skills, you can head over to the free TickTrader platform. Then, once you feel like your Stochastic RSI strategy is ready for action, you can open an FXOpen account. When you do, you will be able to put your skills to the test while benefiting from ultra-fast execution speeds and competitive trading costs. Good luck!
This article represents the opinion of the Companies operating under the FXOpen brand only. It is not to be construed as an offer, solicitation, or recommendation with respect to products and services provided by the Companies operating under the FXOpen brand, nor is it to be considered financial advice.
Stay ahead of the market!
Subscribe now to our mailing list and receive the latest market news and insights delivered directly to your inbox.


Latest articles

AUD/CAD: Months of Indecision — Is a Breakout Finally Coming?
The Australian dollar has clawed back most of its end-of-June losses, when it touched three-month lows against the greenback amid escalating Middle East tensions. Since then, sentiment has improved: the RBA's Assistant Governor Sarah Hunter signalled the board stands ready

USD/JPY: Battling at the Top of the Triangle
On 3 July, Japan's Finance Minister, Satsuki Katayama, stated that the Ministry of Finance remains in close contact with US authorities regarding developments in USD/JPY as the yen traded near its weakest level in almost 40 years. Similar verbal

Dow Jones (DJIA): Consolidation Beyond the Trend
Federal Reserve Chair Kevin Warsh testified before Congress on 14–15 July, reaffirming the Fed's commitment to bringing inflation back to target while providing no clear guidance on the future path of interest rates. Meanwhile, June inflation data came in