


Trading Strategies with Bollinger Bands
FXOpen
The Bollinger Bands indicator has emerged as a versatile tool used by traders to gain an edge in various markets, including forex. This article explores several relevant trading strategies that can help you navigate dynamic market conditions, offering insights into entry and exit points, risk management, and profit-taking opportunities.
What Is the Bollinger Bands Indicator?
The Bollinger Bands indicator is a volatility tool. Developed by John Bollinger, this indicator consists of three primary lines: a middle band, typically a 20-period Simple Moving Average (SMA), and an upper band and lower band, both of which are positioned at a standard deviation distance above and below the middle one. These lines dynamically adjust to market volatility, expanding during periods of heightened price movement and contracting during calmer phases.
Trading Using Bollinger Bands
There are multiple use cases of the indicator, whereby traders focused on the use of Bollinger Bands in forex trading mainly keep a vigilant eye on the asset price's interaction with these lines. Observing the price movement within the depicted range also helps traders spot possibilities for effective trades.
Crafting an effective trading strategy involves several approaches, depending on the current market situation. A common use of Bollinger Bands in forex trading is to identify breakouts of an established trading channel and build a strategy around the assumption that if the price deviates substantially from the mean or average, it eventually reverts to its mean. The best Bollinger Bands trading strategy usually simultaneously uses other technical indicators like the Relative Strength Index (RSI) or the Moving Average for enhanced effectiveness.
All indicators mentioned above are available on FXOpen’s free TickTrader platform. Head over there to explore the possibilities.
Bollinger Bands Trading Strategy Focused on Price Breakouts
This strategy begins with observation. Traders wait for a period of low volatility when the Bollinger Bands tend to contract, bringing the upper and lower lines closer together. This contraction is known as the "squeeze." An example of a bearish breakout can be seen in the chart below. In this particular case, a Moving Averages (MA) crossover confirms the other signals.
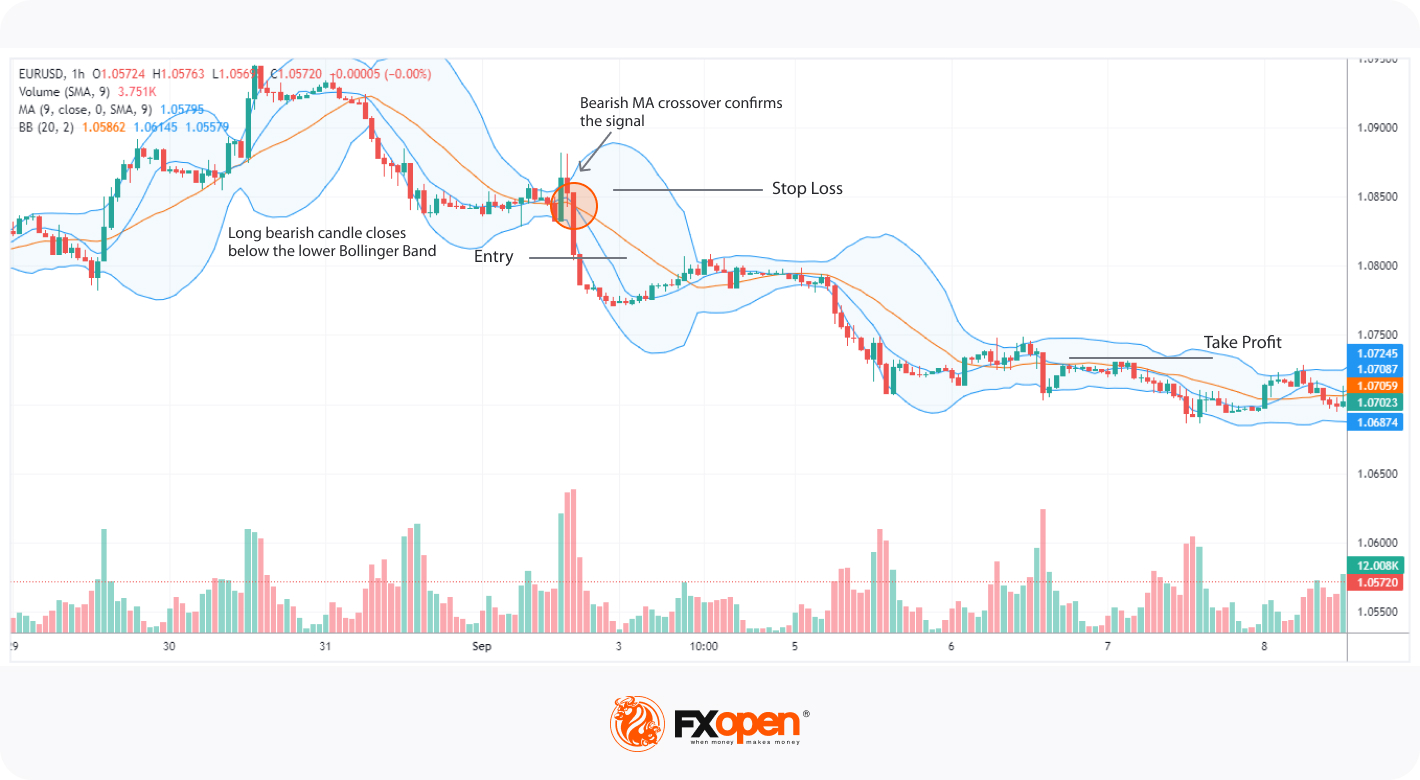
Entry:
- Bullish/Bearish trade: The price decisively breaks above/below the upper/lower band, while a candle closes significantly higher/lower than the upper/lower line. At the same time, the trading range expands, and the volume is high.
Stop loss:
- When buying/selling, the stop-loss is typically placed below the low/above the high of the breakout candle.
Take profit:
- Opportunities for taking a profit in a long/short position when trading using the Bollinger Bands breakout strategy arise when the price approaches key resistance/support levels.
Bollinger Bands and RSI Strategy
When combining the momentum oscillator Relative Strength Index with the Bollinger Band indicator, traders primarily look for overbought/oversold market conditions. If the RSI shows an upward reversal, leaving an oversold area, while the price forms lower lows towards the lower Bollinger line, traders usually consider a long trade. Respectively, if the price climbs towards the upper line while the RSI falls from the overbought area, a short position might be opened. The chart below shows an example of a long trade.
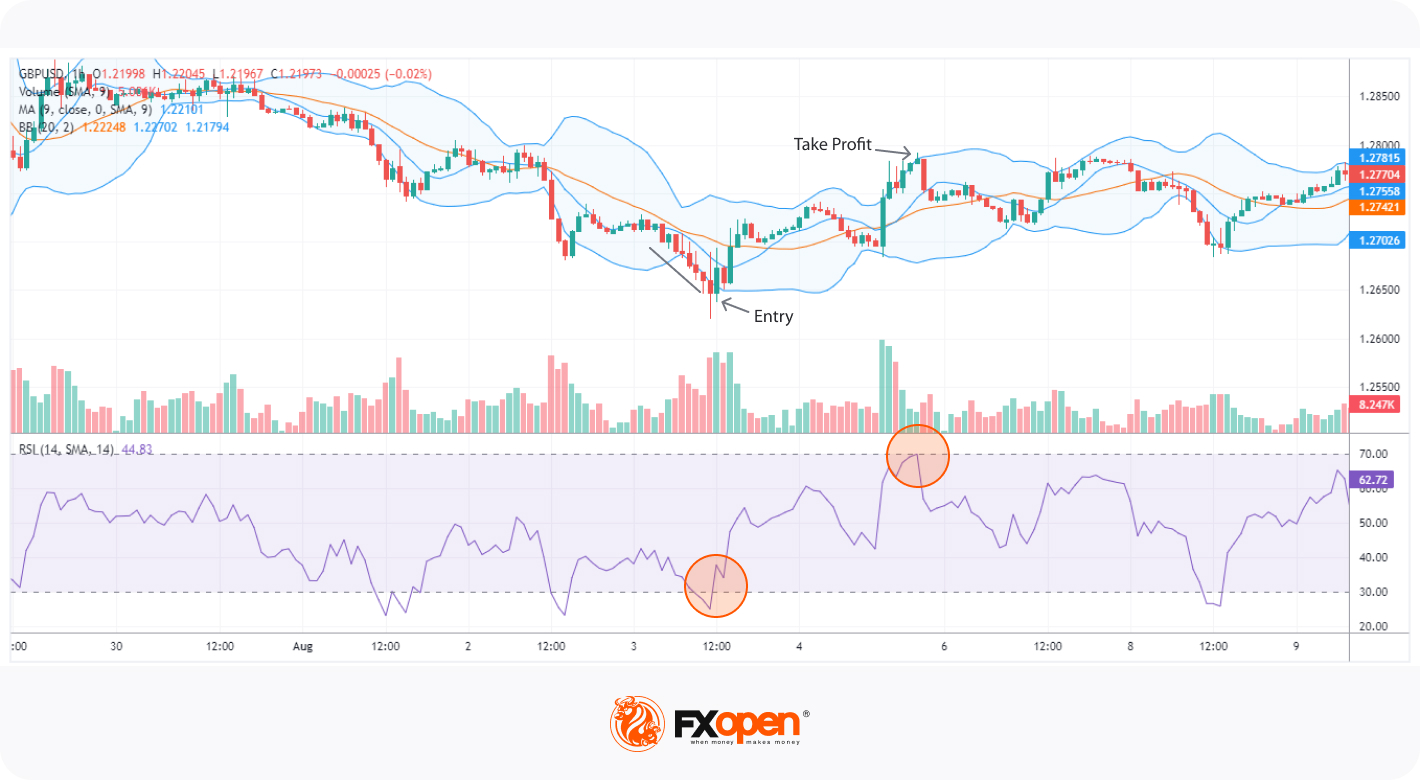
Entry:
- Bullish trade: A good buying opportunity occurs when the price touches the lower Bollinger line, but the RSI makes a sudden upward move to cross above the oversold level of 30. This indicates potential upward momentum despite the price moving down.
- Bearish trade: Opportunity for selling an asset can be spotted when the price climbs to the upper Bollinger line, but the RSI reverses downwards and falls below the overbought level of 70.
Stop loss:
- Long/short position: You can consider placing the stop loss slightly below/above a recent support/resistance level or as a fixed percentage that corresponds to your risk tolerance and trading style.
Take profit:
- Opportunities to take a profit with this particular forex trading Bollinger Bands strategy in a long/short position arise when the price closes near the upper/lower line of the indicator, but the RSI reverses downward/upward, not managing to break up into the overbought area above 70, or down into the oversold area below 30.
The Bollinger Bands and Moving Average Strategy
Traders often combine the Bollinger Band indicator with Moving Averages. The choice of which particular MA to use depends on the time frame and the trading style, yet on an intraday hourly chart, the 10-period Simple Moving Average (SMA) may be a good option. A popular Bollinger Bands and Moving Average strategy involves watching for the asset price to cross both the middle Bollinger line and the chosen MA.
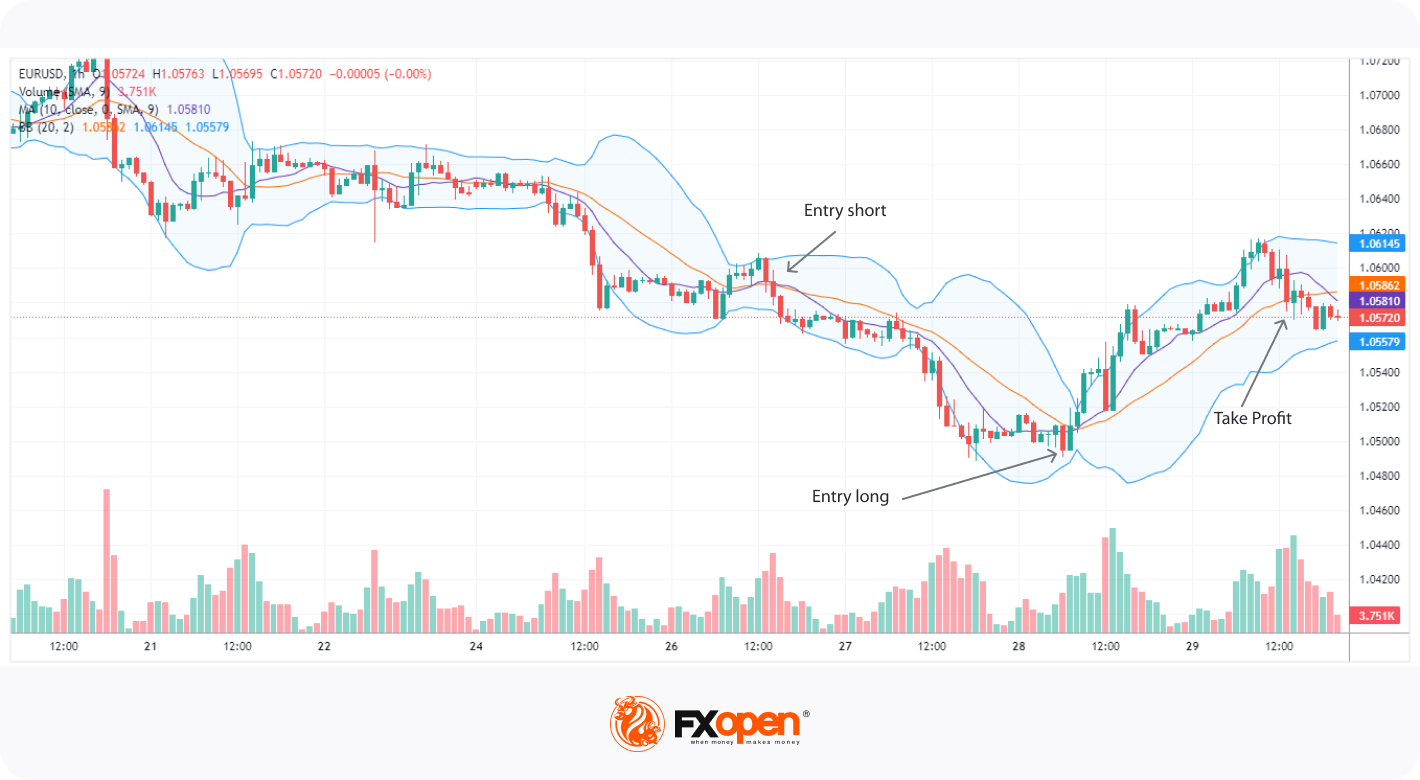
Entry:
- When taking a long position, traders would expect the price to cross from below and rise above both the middle line and the moving average. On the other hand, a price moving down and crossing these lines from above would signal a shorting opportunity.
Stop loss:
- For long trades, the stop-loss may be set below the recent price swing or a significant support level.
- For short trades, the stop-loss may be set above the recent price swing or a significant resistance level.
Take profit:
- When following this strategy, a reversal of the price towards the middle line and the MA, respectively crossing them, could signal a good time to exit the position.
Final Thoughts
A successful forex trading Bollinger Bands strategy can be built around assessing market volatility, spotting breakouts or overbought/oversold conditions, and managing the risks. The Bollinger Bands indicator offers valuable insights; however, it's essential to remember that achieving successful outcomes in forex trading requires a blend of multiple technical analysis tools, prudent risk management, and market awareness.
Ready to put some of these strategies to the test? Open an FXOpen account and start an exciting trading journey!
This article represents the opinion of the Companies operating under the FXOpen brand only. It is not to be construed as an offer, solicitation, or recommendation with respect to products and services provided by the Companies operating under the FXOpen brand, nor is it to be considered financial advice.
Stay ahead of the market!
Subscribe now to our mailing list and receive the latest market news and insights delivered directly to your inbox.


Latest articles

Weekly Market Insights with Gary Thomson: The Week of Central Banks and Earnings
In this video, we’ll explore the key economic events and market trends, shaping the financial landscape. Get ready for insights into financial markets to help you navigate the week ahead. Let’s dive in!
In this episode of Market

Intel at a Crossroads: Earnings Beat Meets Technical Resistance
Intel has just delivered its strongest quarter in over fifteen years, and the market reaction says it all. Q2 2026 revenue surged 25% year-over-year to $16.1 billion, crushing the consensus estimate of $14.42 billion, while adjusted EPS of

Tesla: Complex Range Structure Breaks Down Following Quarterly Earnings
Tesla released its Q2 2026 results after the market closed on 22 July. Revenue increased 26% year-on-year to $28.24 billion, while vehicle deliveries reached a record 480,126 units. However, operating margin fell sharply to 1.4%, down from