


Trading the Volatility Breakout System
FXOpen
Navigating the complexities of the financial markets requires a solid understanding of various trading strategies. One approach that has garnered attention for its efficacy is the volatility breakout system. This article delves into the essentials of market volatility, outlines the basic volatility breakout strategy, and explores a variant using Bollinger Bands.
Understanding Market Volatility
Volatility refers to the degree of variation in an asset's price over a specific time frame. It's an essential concept in trading because it gives traders an idea of how much an asset—be it a stock, commodity, or currency—might move. High volatility typically signifies larger price swings, presenting both increased risk and opportunity, whereas low volatility suggests smaller, more stable price movements.
One common method to measure volatility is through historical volatility, which gauges past price fluctuations to get a sense of potential future variability. It calculates the standard deviation of daily returns, offering a statistical view of market behaviour.
Traders often turn to charts to identify periods of high and low volatility visually. In a high-volatility environment, an asset's price will show larger swings and move a significant distance in a short time. Conversely, low volatility is identified by an asset trading within a tighter price range.
Different market conditions induce varying degrees of volatility. For instance, major economic announcements or global events can cause spikes in volatility, impacting both long and short trades. Understanding the nature and triggers of volatility is crucial for traders, as it plays a significant role in the selection of trading strategies, risk management, and potential returns.
The Basic Volatility Breakout Strategy
The volatility breakout system focuses on capturing significant price movements that occur when an asset transitions from a low-volatility phase to a high-volatility phase. For the best understanding of these volatility breakout system rules, head over to FXOpen’s free TickTrader platform to access real-time charts.
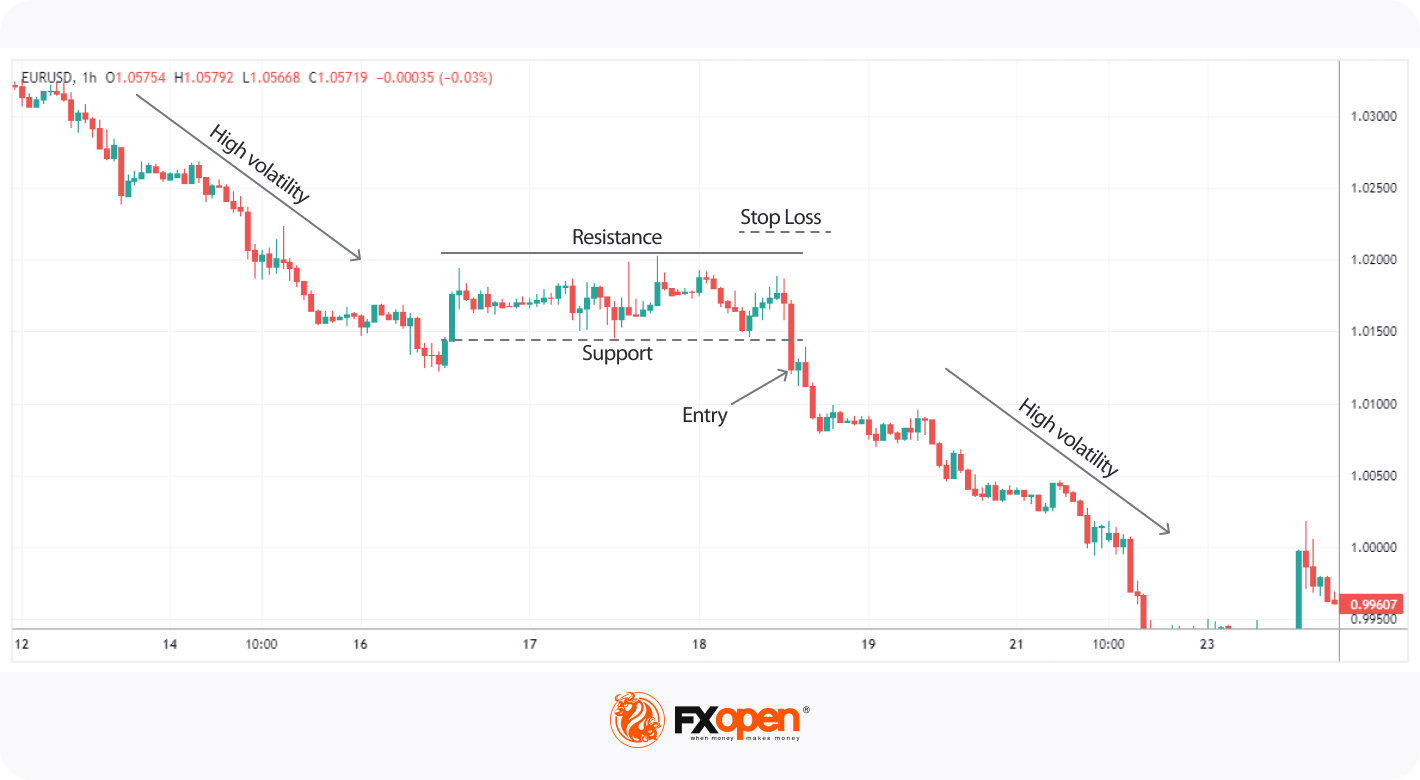
To identify a transition from low to high volatility, traders typically look for a range-bound market characterised by small price oscillations. Within this range, they identify key support and resistance levels that bracket the asset's price movements. Traders look for resistance breaks in an uptrend and vice versa. A decisive break above the resistance or below the support level often serves as an entry point for a trade.
Entry
Traders often observe the asset for range-bound conditions. A decisive break above or below a resistance or support level may signal an entry point.
Stop Loss
Stop-loss orders are commonly placed just outside the identified range, either above resistance for short trades or below support for long trades.
Take Profit
Targets are generally set in a way that the potential profit is at least twice the size of the risk taken, offering a favourable risk-reward ratio.
This strategy can be employed in various markets and timeframes, but it is crucial to be vigilant about risk management and to be aware of any potential market-moving news that could impact volatility.
Volatility Breakout Strategy Using Bollinger Bands
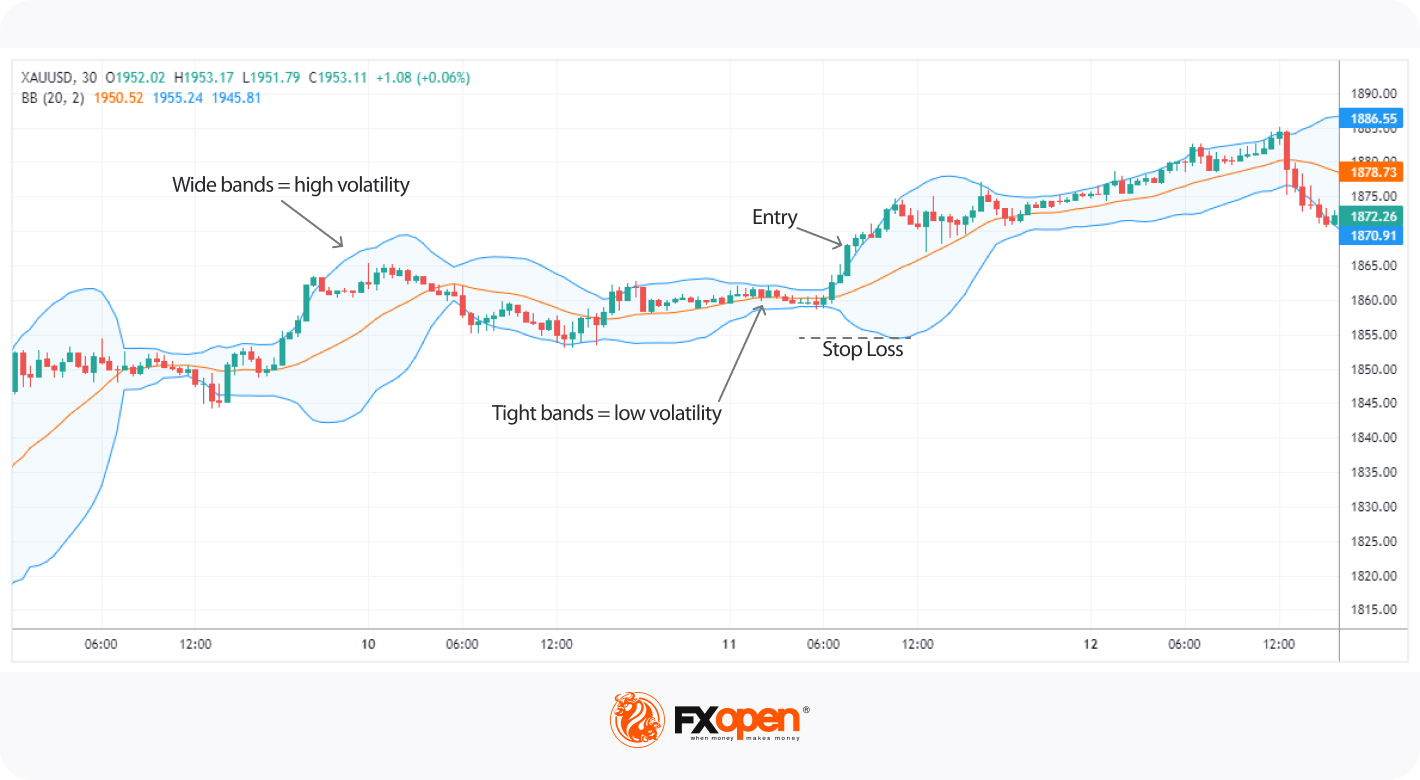
Bollinger Bands serve as a powerful tool for measuring market volatility in a breakout system. The indicator consists of a 20-period moving average as the centerline, flanked by two bands that are two standard deviations away from the average. These bands dynamically adjust to market conditions, expanding during high volatility and contracting during periods of low volatility.
Traders interested in the volatility breakout strategy frequently use Bollinger Bands to improve entry and exit points. When the asset's price is consolidating, the bands will contract, indicating lower volatility. Conversely, when the bands widen, it suggests a transition to a higher volatility phase.
Entry
Traders may consider an entry when the price decisively crosses the upper band, indicating a potential for a long trade. Conversely, a decisive break below the lower band might be an entry point for a short trade.
Stop Loss
A stop loss can be placed above the upper band for short trades and below the lower band for long trades, aiming to minimise potential losses.
Take Profit
Some traders might aim for a target that is twice the distance from the entry to the stop loss.
Others may keep the trade open until the price touches the middle band or the opposite band, suggesting that the volatility phase may be ending.
Managing Trades
Effectively managing trades is pivotal for the success of any trading strategy, including volatility breakout systems. Here are some insights tailored specifically for these approaches you may want to use:
- Risk-Reward Ratio: Strive for a favourable risk-reward ratio, typically setting the take-profit level at least twice as far from the entry point as the stop loss.
- Pending Orders: Utilise pending orders like 'Buy Stop' or 'Sell Stop' to automatically trigger entries, which is particularly useful for traders who can't constantly monitor the markets.
- Trailing Stops: Implement trailing stop orders to lock in profits as the asset price moves in a favourable direction, automatically adjusting the stop loss as the price advances.
- Timeframes: Be mindful of the timeframe being traded; longer timeframes might require wider stop loss and take profit margins due to increased volatility.
- Market News: Stay abreast of economic calendars and market news, as unexpected events can significantly affect volatility and, consequently, the trade.
The Bottom Line
In summary, understanding market volatility and strategies like the volatility breakout system can significantly enhance a trader's decision-making process. Whether utilising traditional methods or incorporating Bollinger Bands, effective risk management remains paramount. For those eager to apply these strategies in real-time, consider taking the next step by opening an FXOpen account to access over 600 markets and 1,200 trading tools in the advanced TickTrader platform. Also, you can test volatility breakout systems in MT4, MT5, and TradingView platforms with FXOpen.
This article represents the opinion of the Companies operating under the FXOpen brand only. It is not to be construed as an offer, solicitation, or recommendation with respect to products and services provided by the Companies operating under the FXOpen brand, nor is it to be considered financial advice.
Stay ahead of the market!
Subscribe now to our mailing list and receive the latest market news and insights delivered directly to your inbox.


Latest articles

US Dollar Index: A Defining Week for the King of the Markets
The dollar heads into a pivotal week trading near 101.80, just off a 15-month high, with the Fed's July 29 meeting standing as the clear focal point. Markets currently price roughly a 65% chance of a hold, though renewed

NZD/USD: Inflation Surge Meets Strong US Dollar Pressure
On 21 July, Stats NZ reported an acceleration in inflation: the Consumer Price Index rose 1.5% in the second quarter, while the annual inflation rate climbed to 4.1%, its highest level in more than two years and slightly

Weekly Market Insights with Gary Thomson: The Week of Central Banks and Earnings
In this video, we’ll explore the key economic events and market trends, shaping the financial landscape. Get ready for insights into financial markets to help you navigate the week ahead. Let’s dive in!
In this episode of Market