


FXOpen

Technical analysis is a method used in the financial markets to evaluate and forecast future price movements of assets, such as stocks, currencies, commodities, and cryptocurrencies*, based on historical price data. Trading with trendlines is a fundamental aspect of technical analysis employed by traders and investors to decipher market trends and optimise trading decisions. This article will cover how to draw trendlines on candlestick charts and will explain several trendline strategies.
What Are Trendlines?
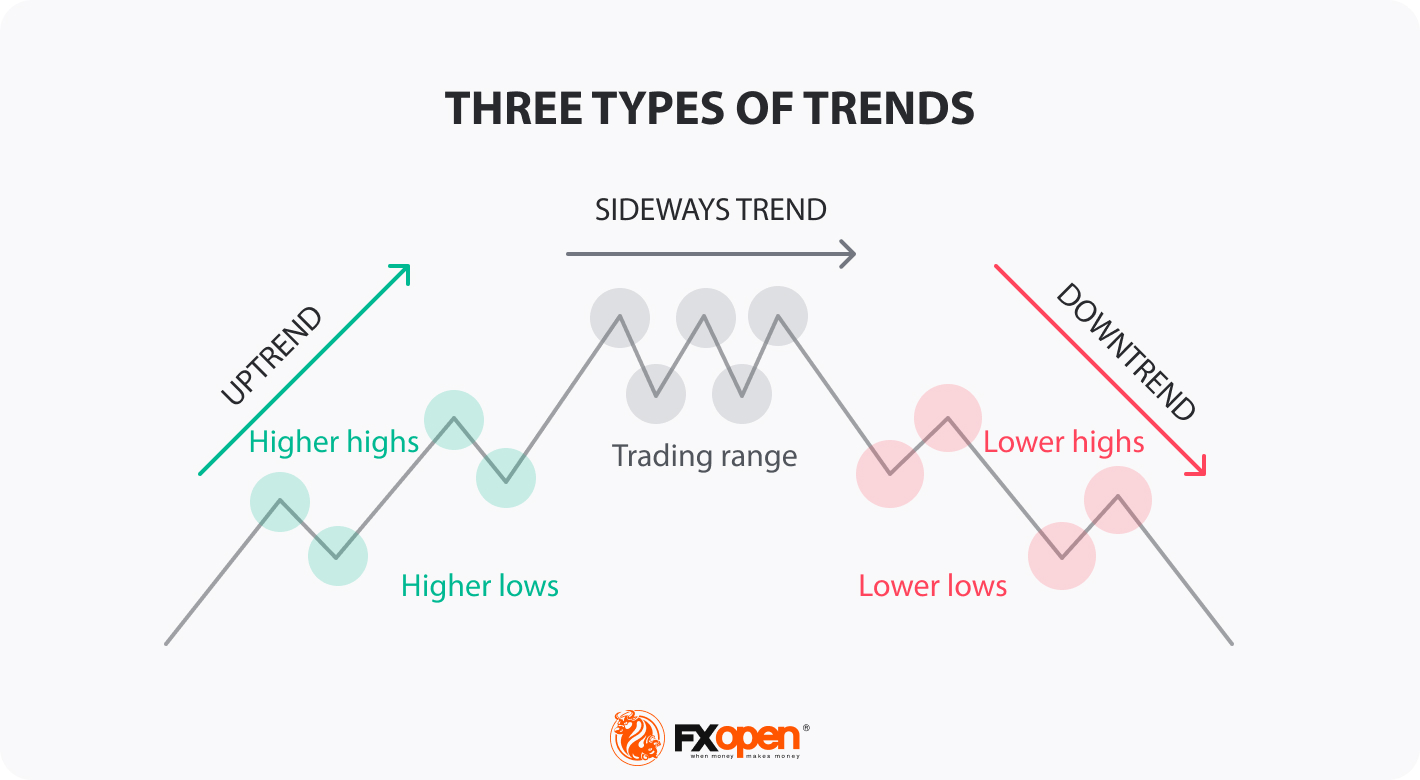
Trendlines are graphical representations of price movements, helping traders visualise the overall direction of a market trend. They can be either upward (bullish), downward (bearish), or horizontal (sideways). Bullish trendlines connect ascending highs and lows, bearish trendlines connect descending highs and lows, while horizontal lines connect almost equal highs and lows.
How to Draw a Trendline Correctly
Drawing trendlines accurately is crucial for making correct trading decisions. To draw an upward trendline, you will need at least two higher swing lows and two higher swing highs through which you will draw a straight line. For a downward trendline, you will need to spot two lower swing highs and two lower swing lows and draw a straight line connecting them. It's essential to avoid forcing trendlines to fit the data but rather let them emerge naturally from the price chart. To draw a horizontal trend line, first, identify a sideways price movement. Then, draw straight lines connecting equal highs and lows.

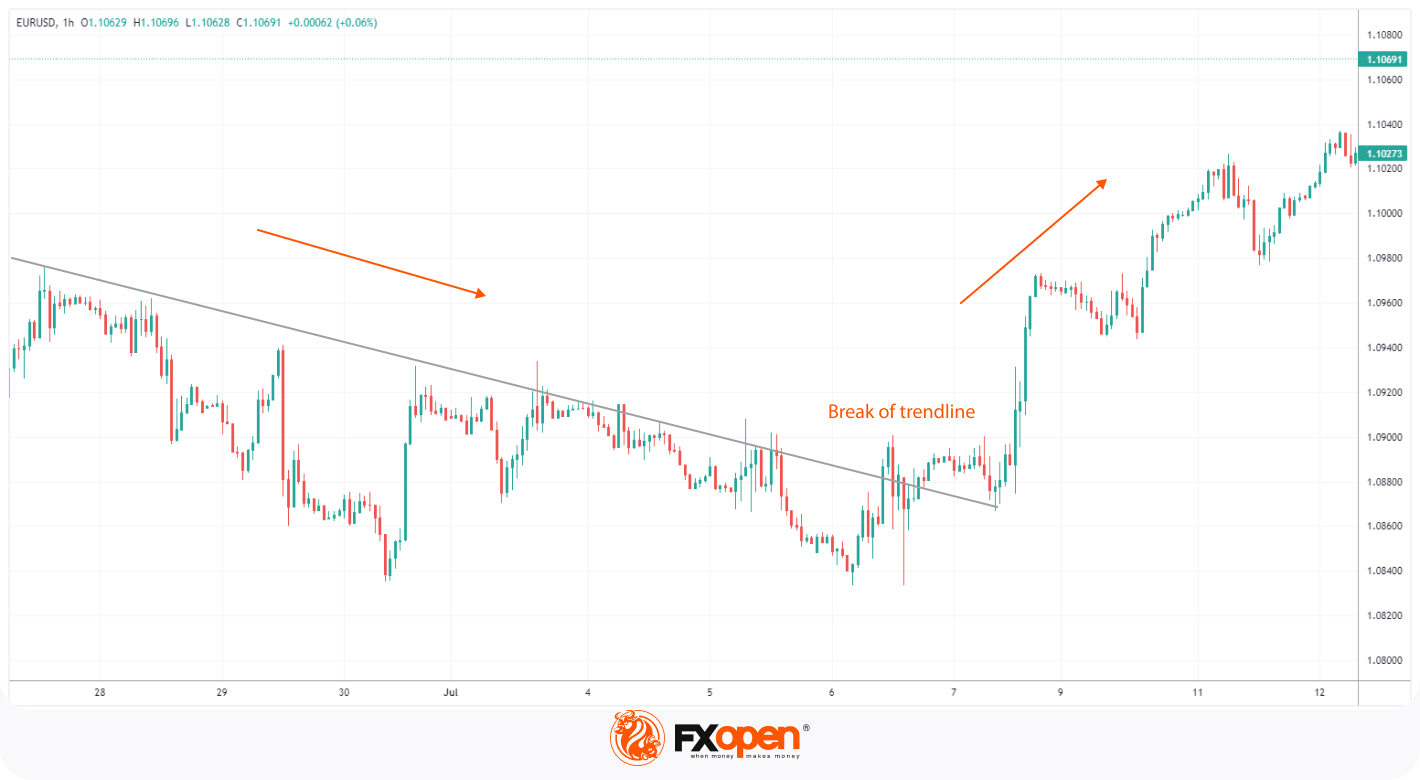
On the TickTrader chart of EURUSD, you can see how to draw a trendline in the forex market. The drawing methodology stays the same for trendlines in stocks, futures, and all other assets.
How to Use Trendlines
Trendlines are used not only to spot market trends but also to determine their reversals and find support and resistance levels.
Identifying Trends and Trend Reversals with Trendlines
Trendlines provide valuable insights into trend identification and potential trend reversals. A trendline that remains intact suggests a continuation of a trend, while a break in the trendline may indicate a potential trend reversal. Due to the risks of fakeouts, traders can use additional technical indicators or chart patterns to confirm trend reversals. Also, it’s important to remember that the more often the price touches the trendline, the more likely it will be broken soon.
Support and Resistance Levels
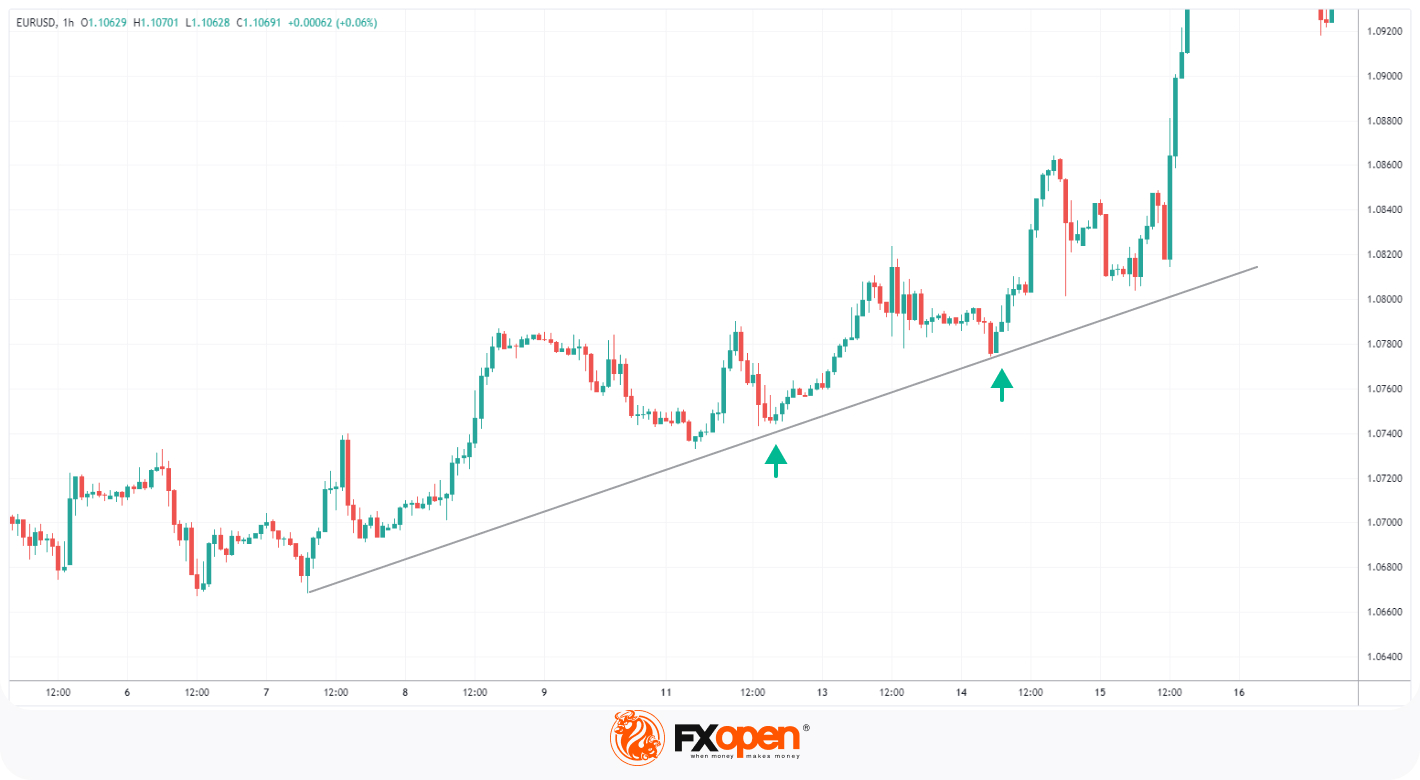
Trendlines in forex, stocks and other financial instruments also serve as support and resistance levels. In an uptrend, the trendline acts as support, preventing the price from declining significantly. The green arrows in the chart below show all the support points.
In contrast, the trendline functions as resistance in a downtrend, limiting the price from rising substantially. The red arrow below shows the respective resistance points.
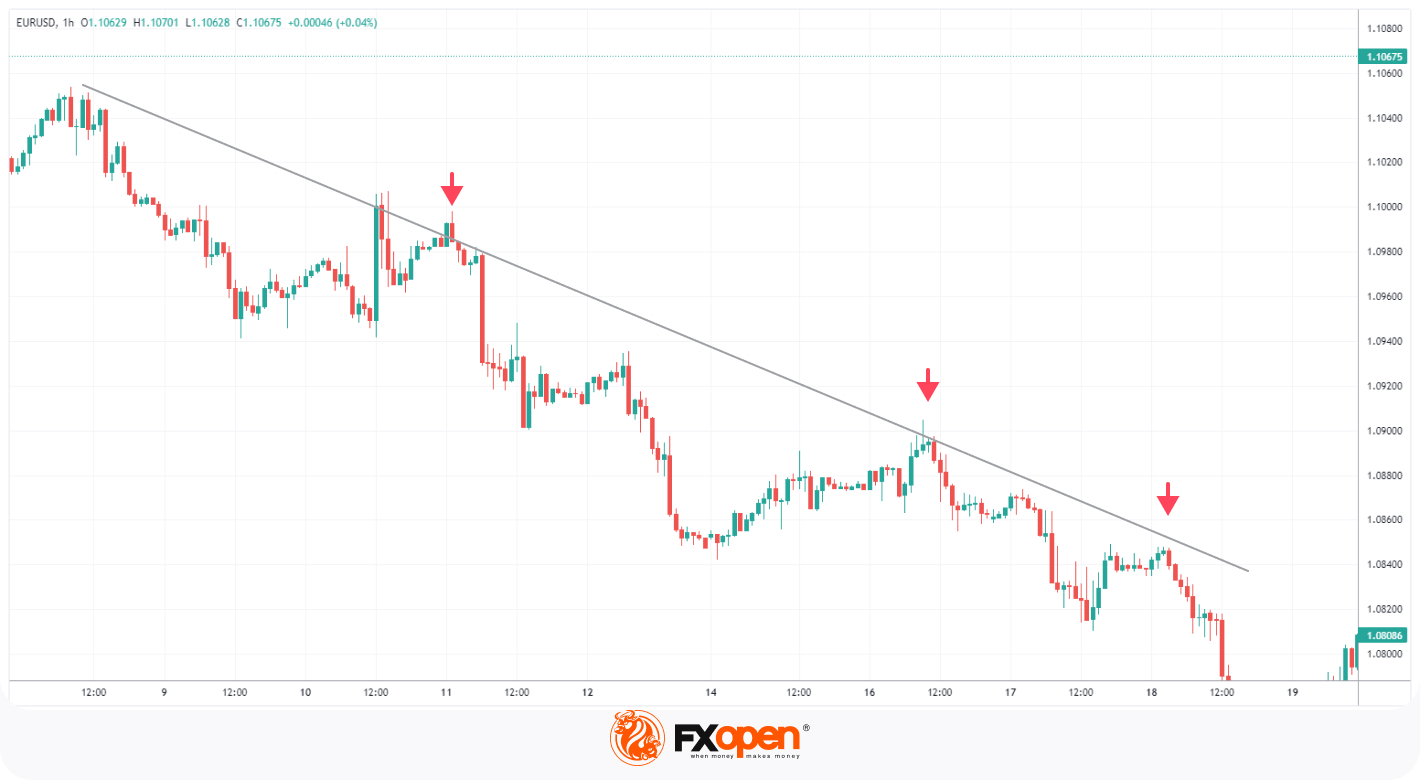
Identifying these levels may help traders determine the potential entry and exit points of their trades.
The horizontal trendline can be drawn after an up or downtrend. The market constantly ranges between support and resistance levels to form a channel or a rectangular box.
Trading Strategies with Trendlines
Let us go through some popular strategies for trading trendlines in forex, stocks, and other instruments:
Uptrends
In uptrends, traders draw ascending trendlines connecting two higher swing lows and look for potential buying opportunities when the price touches or comes close to the trendline. This suggests that buyers are entering at a favourable price, increasing the likelihood of the uptrend continuing. Additionally, the upper trendline in an uptrend can serve as a take-profit target for traders. As the price approaches this upper trendline, some traders may consider selling their positions to lock in profits before a potential pullback or trend reversal occurs.
Downtrends
Similarly, in downtrends, traders draw descending trendlines connecting two lower swing highs and watch for price retracements towards the trendline. Such retracements may indicate a selling opportunity as sellers re-enter at higher price levels. This strategy improves entry timing and reduces the risk of chasing price movements. Moreover, the lower trendline in a downtrend can act as a take-profit target. When the price reaches this lower trendline, traders may consider closing their short positions to secure profits, anticipating a potential bounce or reversal.
Horizontal Movements
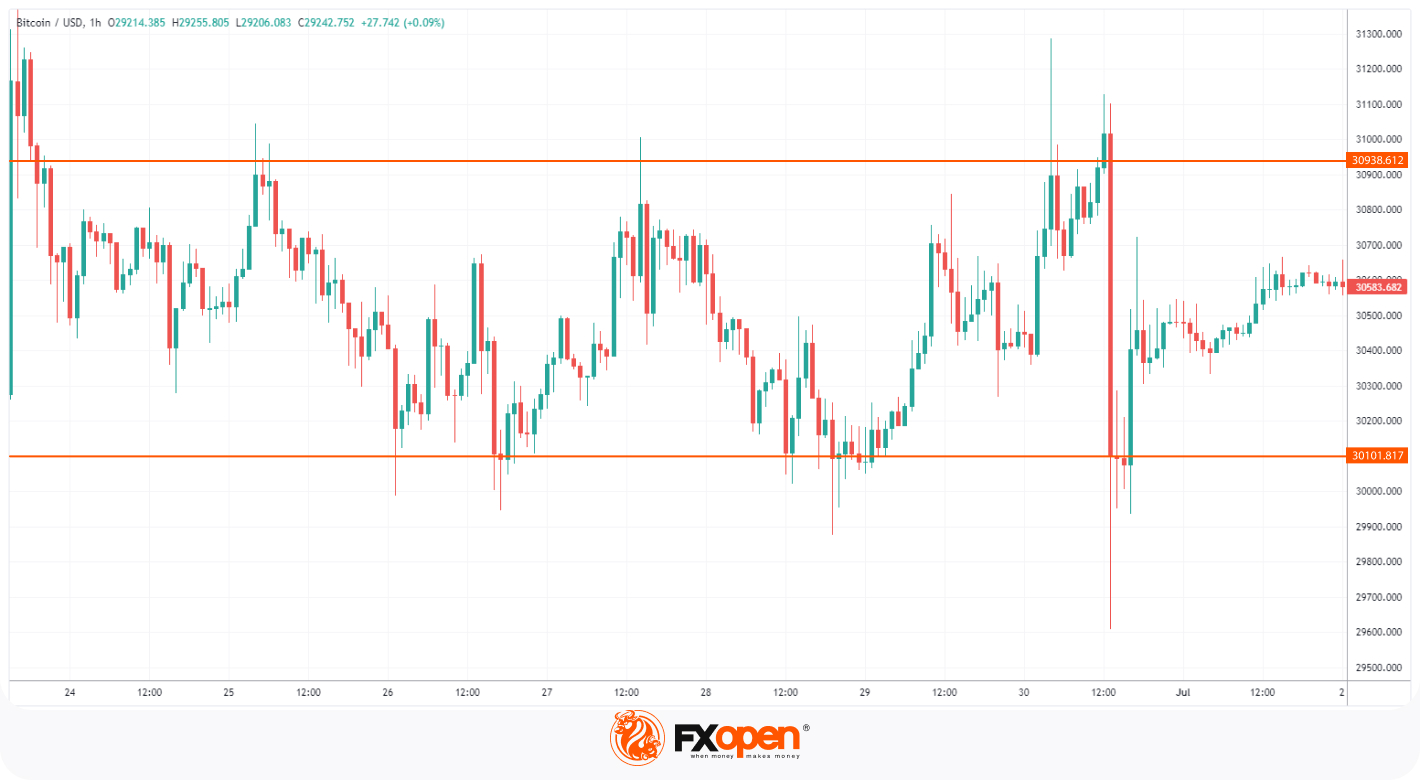
Horizontal trendlines may help identify crucial support and resistance levels when the price moves sideways, guiding traders in determining favourable buying (at support) and selling (at resistance) opportunities. Breakouts from these levels act as strong signals for potential trend continuation or reversal, aiding traders in making strategic decisions. Furthermore, horizontal trendlines serve as practical references for setting take-profit and stop-loss levels, enabling traders to manage their risk effectively.
Breakouts
The trendline breakout strategy involves identifying well-established trendlines connecting significant swing highs or lows. Traders wait for a strong close below the lower (in uptrends) or above the upper (in downtrends) trendline, along with increased trading volume to confirm the breakout. They then enter trades in the direction of the breakout, expecting the new trend to continue. Risk management is crucial in this strategy, with stop-loss orders used to protect against false breakouts or trend reversals.
To ride massive trends and capture substantial profits, traders draw a trendline connecting multiple significant swing highs or lows and extend it beyond the most recent price data. As long as the price stays within the extended trendline, traders maintain their position, anticipating the trend's continuation. Close monitoring of price action and being prepared to exit the trade if there are signs of a trend reversal or a break below the dynamic trendline is essential for successful implementation.
Steps for Effective Trendline Trading
Trendline trading can be highly effective, but it requires skill and discipline. Here are some essential steps you may want to consider to enhance your trendline trading while trading on FXOpen:
- Use multiple timeframes to validate trendlines: Draw trendlines on higher timeframes to identify significant trends and then use lower timeframes for more precise entry and exit points.
- Seek confirmation with other technical analysis tools: Combine trendline analysis with other technical indicators such as moving averages, MACD, or RSI to strengthen your trade decisions and improve confirmation signals.
- Patience is Key: Be patient and wait for the right moments to enter trades based on trendline strategies. Avoid chasing price movements and always wait for confirmations. Also, history shows that following trends is the most prominent strategy.
- Adjust and Adapt: Regularly review and adjust your trendlines to reflect the most recent price action and market developments. Trends can evolve, so be adaptable in your approach.
- Risk Management: Implement proper risk management techniques, including setting stop-loss orders to protect yourself from false breakouts.
- Consider Market Conditions: Take into account the overall market conditions, such as trending markets, ranging markets, or volatile markets. Certain trendline strategies may work better in specific market conditions, so adjust your approach accordingly.
- Backtesting: Before implementing a new trendline strategy, perform backtesting on historical data to assess its effectiveness. This helps you gauge the strategy's success rate and identify potential weaknesses.
If you want to add trendlines to your strategy, you can open an FXOpen account.
Conclusion
Successful trendline trading requires skills, discipline, and a comprehensive understanding of market dynamics. By incorporating the most popular strategies into your trading approach, you may make more informed decisions and improve your overall trading performance. Experienced traders say it’s worth staying updated on market developments and continuously refining trading strategies for better results.
*At FXOpen UK and FXOpen AU, Cryptocurrency CFDs are only available for trading by those clients categorised as Professional clients under FCA Rules and Professional clients under ASIC Rules, respectively. They are not available for trading by Retail clients.
This article represents the opinion of the Companies operating under the FXOpen brand only. It is not to be construed as an offer, solicitation, or recommendation with respect to products and services provided by the Companies operating under the FXOpen brand, nor is it to be considered financial advice.
Latest articles

GBP/USD Bulls Struggle While USD/CAD Regains Strength
GBP/USD declined below the 1.2550 support zone. USD/CAD is rising and might aim for more gains above the 1.3760 resistance.
Important Takeaways for GBP/USD and USD/CAD Analysis Today
· The British Pound started a fresh

AUD/USD Analysis: Aussie Weakens After RBA Decision
Following its decision on 7th May, the Reserve Bank of Australia (RBA) opted to maintain the interest rate at 4.35%, despite inflation continuing to decrease at a slower pace than anticipated by the RBA.
"I think we still think
The Hang Seng Index Has Risen by Over 13% in 2 Weeks
Analyzing the Hang Seng (Hong Kong 50 at FXOpen) chart, we wrote on January 30th that the price was near an important support level formed by the lower boundary (shown in orange) of a long-term channel, which has been relevant